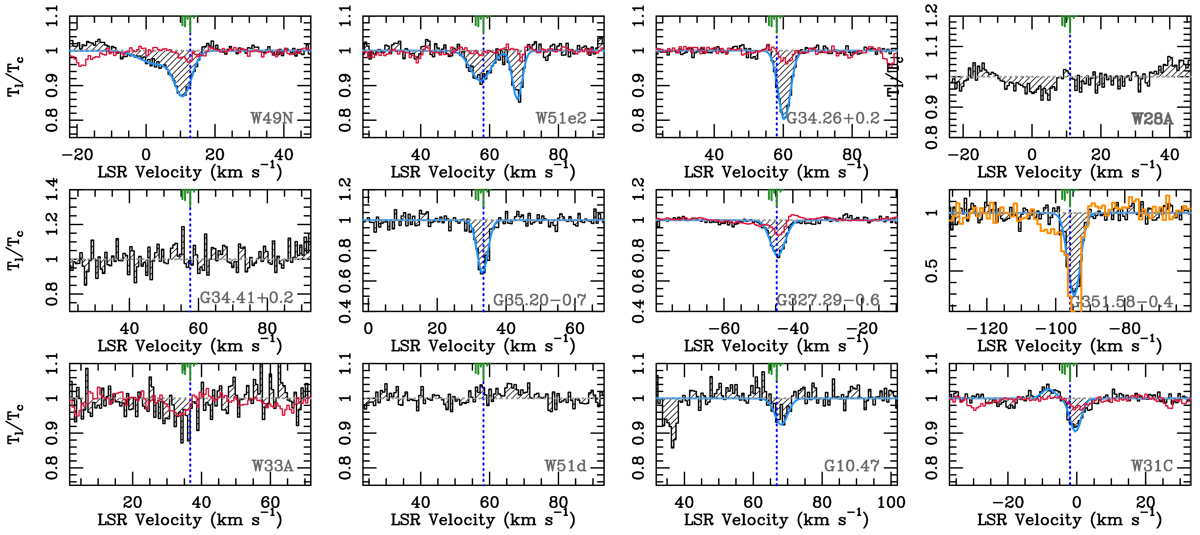
Fig. 3
Download original image
Overview of the OD 2Π3∕2 ground-state(J = 5∕2−3∕2) transition towards the sample. The spectra are normalised to the continuum level and thus show the line-to-continuum ratio. The rest frequency is set to the strongest hyperfine transition, F=7/2−−5∕2+, at 1391494.70 MHz. The vertical blue dotted line marks the systemic LSR velocity of the source (Table 1), horizontal grey dotted line shows the intensity ratio of 1. The light blue line shows a single or a two-component Gaussian fit to the spectrum. The positions and the relative strength of the hyperfine components are shown in green. The red spectra correspond to the HDO (JK,A = 11,1−00,0) line at 893.6GHz from Herschel/HIFI, the orange spectrum shows the same line observed with the APEX telescope. The source name is labelled in the lower right corner of each panel.
Current usage metrics show cumulative count of Article Views (full-text article views including HTML views, PDF and ePub downloads, according to the available data) and Abstracts Views on Vision4Press platform.
Data correspond to usage on the plateform after 2015. The current usage metrics is available 48-96 hours after online publication and is updated daily on week days.
Initial download of the metrics may take a while.