Open Access
Fig. C.1
Download original image
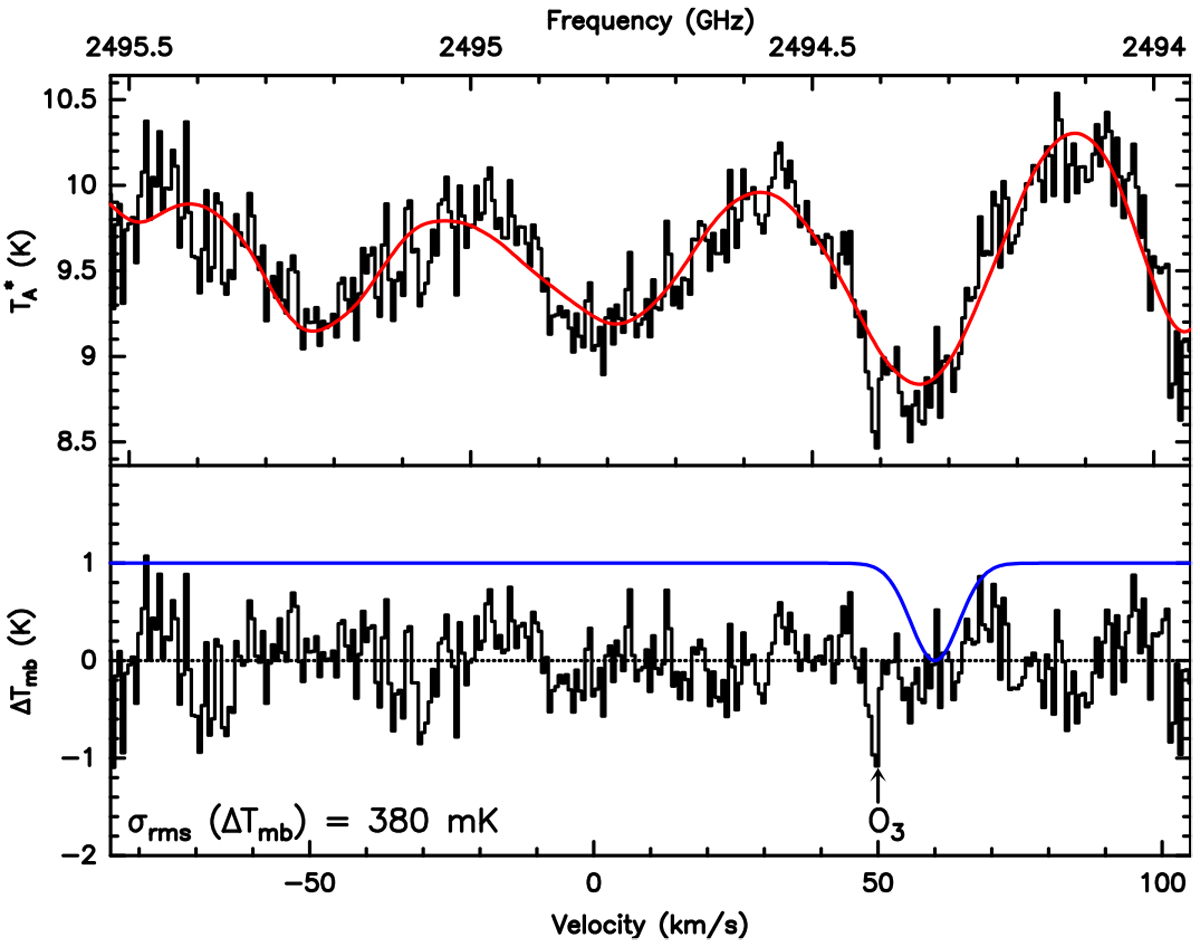
Spectrum of 18OH 2Π3∕2 before (top) and after (bottom) removal of the SVD derived baseline (red line, top) and transmission correction. The relatively narrow kernel of a telluric O3 line is deliberately left uncorrected. The blue line represents the weight profile used in the χ2 minimisation.
Current usage metrics show cumulative count of Article Views (full-text article views including HTML views, PDF and ePub downloads, according to the available data) and Abstracts Views on Vision4Press platform.
Data correspond to usage on the plateform after 2015. The current usage metrics is available 48-96 hours after online publication and is updated daily on week days.
Initial download of the metrics may take a while.