Open Access
Fig. A.1
Download original image
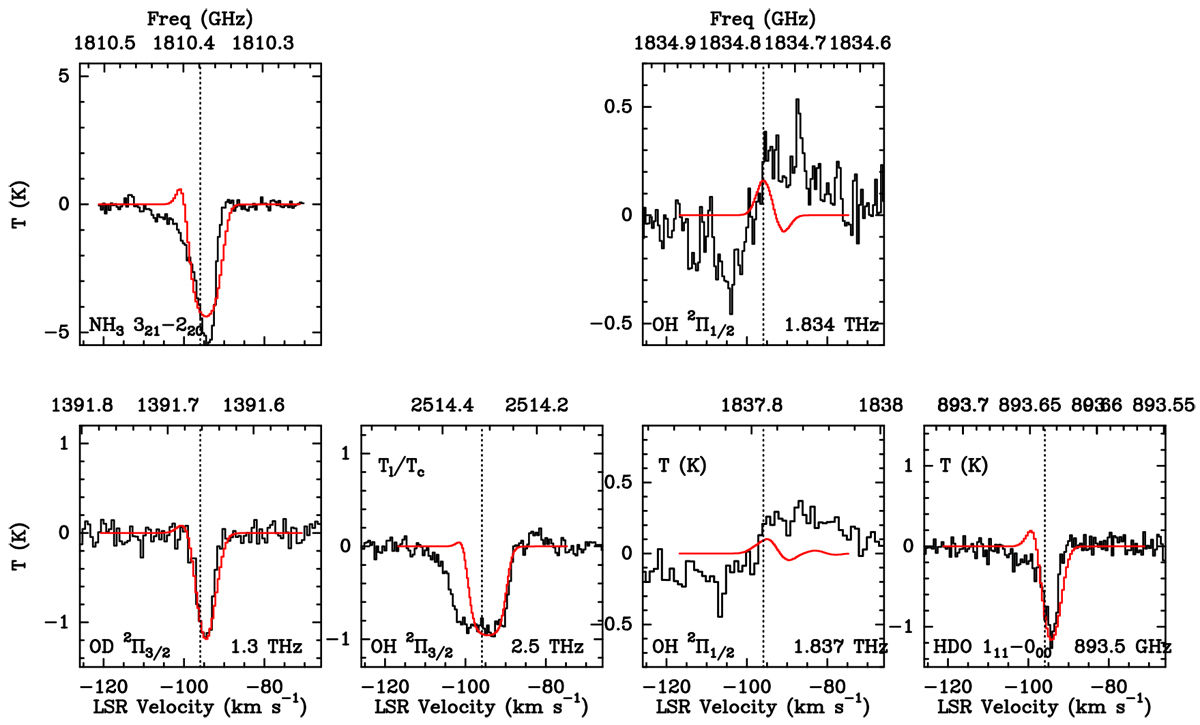
Same as Fig. 6, but for G351.58−0.4. The observed spectra are shown in black, red line shows the fitted RATRAN model. Dotted line marks the vlsr of the source. The panel for the 2Π3∕2 J=5/2-3/2 transition at 2514 GHz shows the line-to-continuum ratio (Tl∕Tc), all other panels show the line temperature in Kelvins.
Current usage metrics show cumulative count of Article Views (full-text article views including HTML views, PDF and ePub downloads, according to the available data) and Abstracts Views on Vision4Press platform.
Data correspond to usage on the plateform after 2015. The current usage metrics is available 48-96 hours after online publication and is updated daily on week days.
Initial download of the metrics may take a while.