Fig. 6.
Download original image
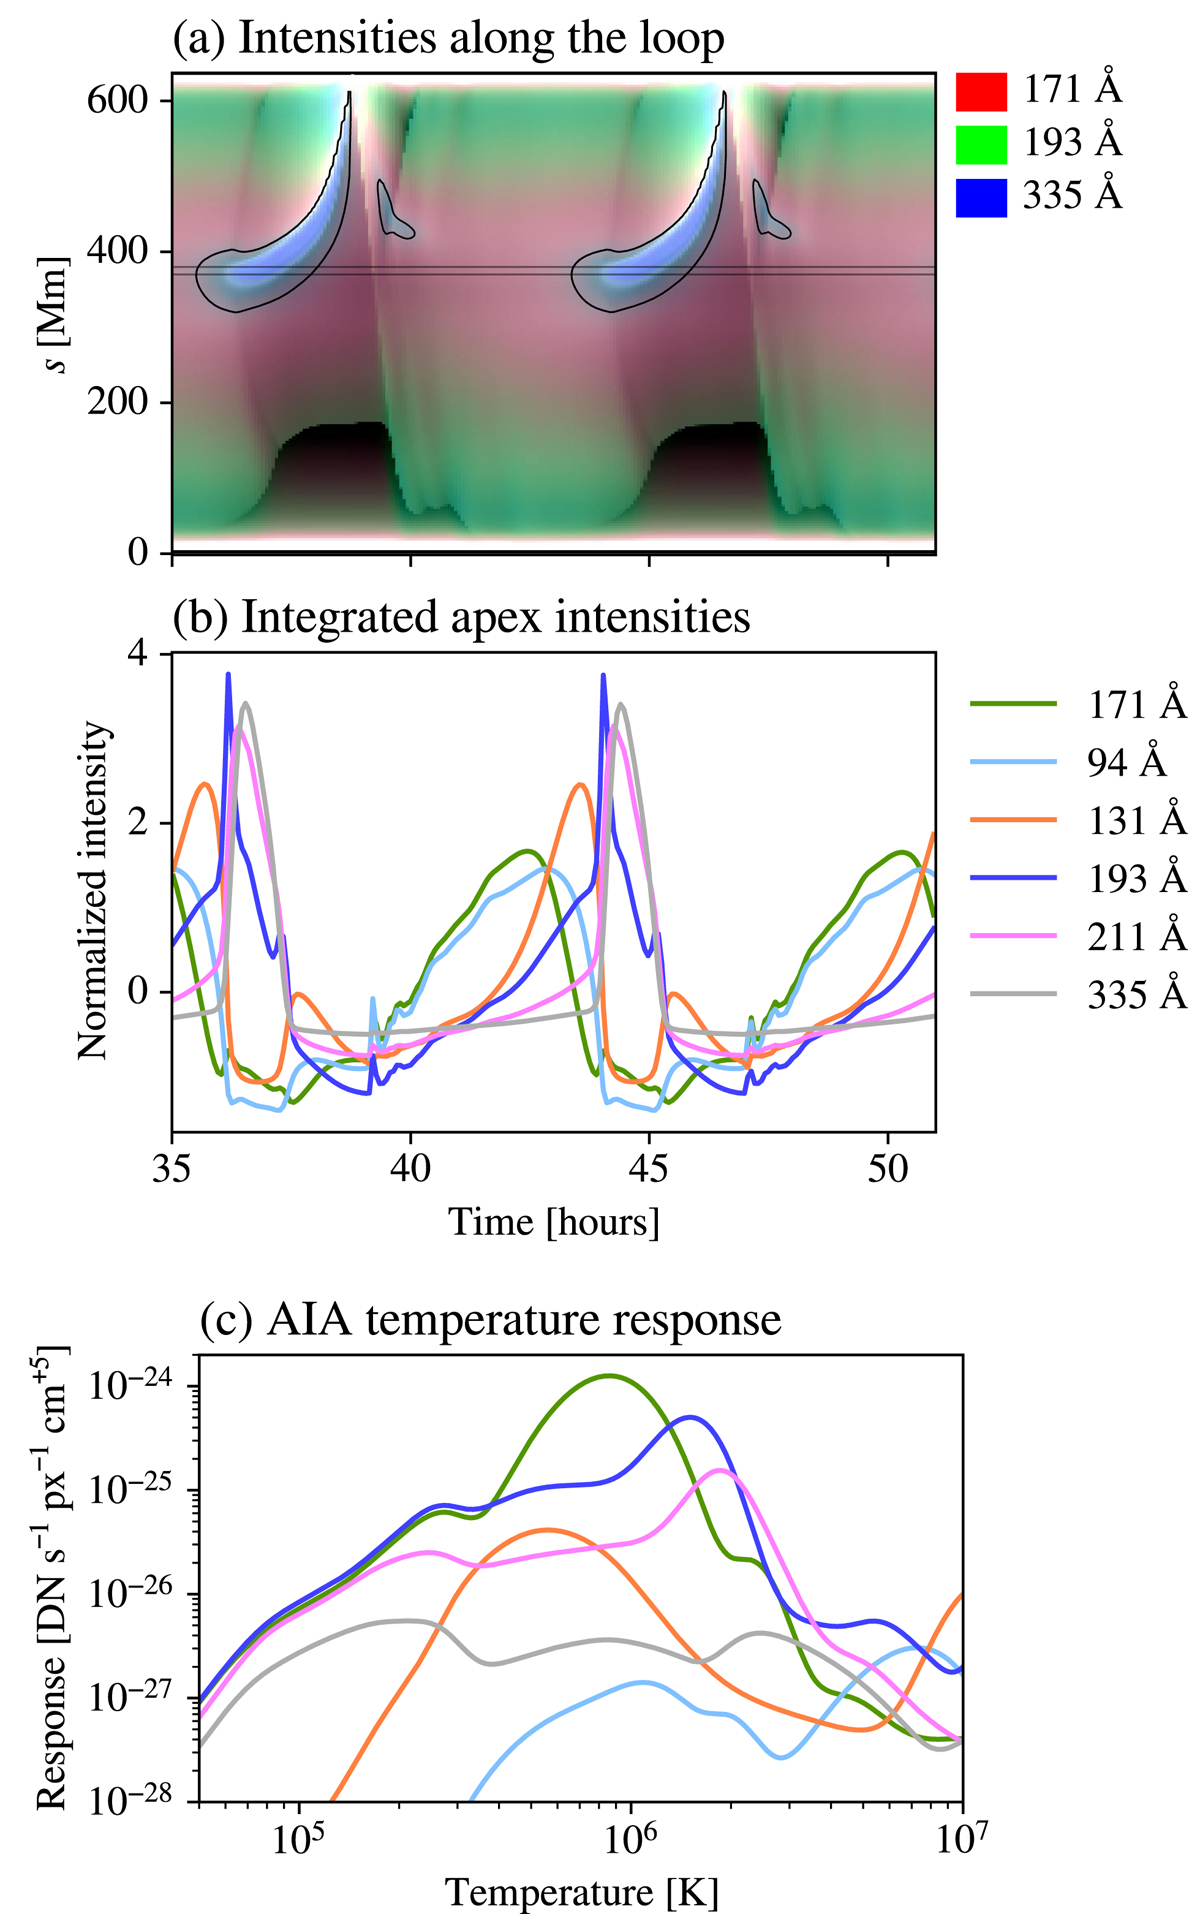
Synthetic intensities for the simulation that reproduces the observations of the rain bow best. (a) Intensity in the 171 Å (red), 193 Å (green), and 335 Å (blue) bands of SDO/AIA as a function of the position along the loop and time. The black contour shows regions where the temperature is lower than 0.5 MK. (b) Intensities in the six coronal channels of AIA, integrated close to the apex, (370 Mm < s < 380 Mm). Each light curve was normalised by subtracting its average and dividing by its standard deviation. (c) Temperature-response function of the SDO/AIA channels shown in panel (b).
Current usage metrics show cumulative count of Article Views (full-text article views including HTML views, PDF and ePub downloads, according to the available data) and Abstracts Views on Vision4Press platform.
Data correspond to usage on the plateform after 2015. The current usage metrics is available 48-96 hours after online publication and is updated daily on week days.
Initial download of the metrics may take a while.