Fig. 4.
Download original image
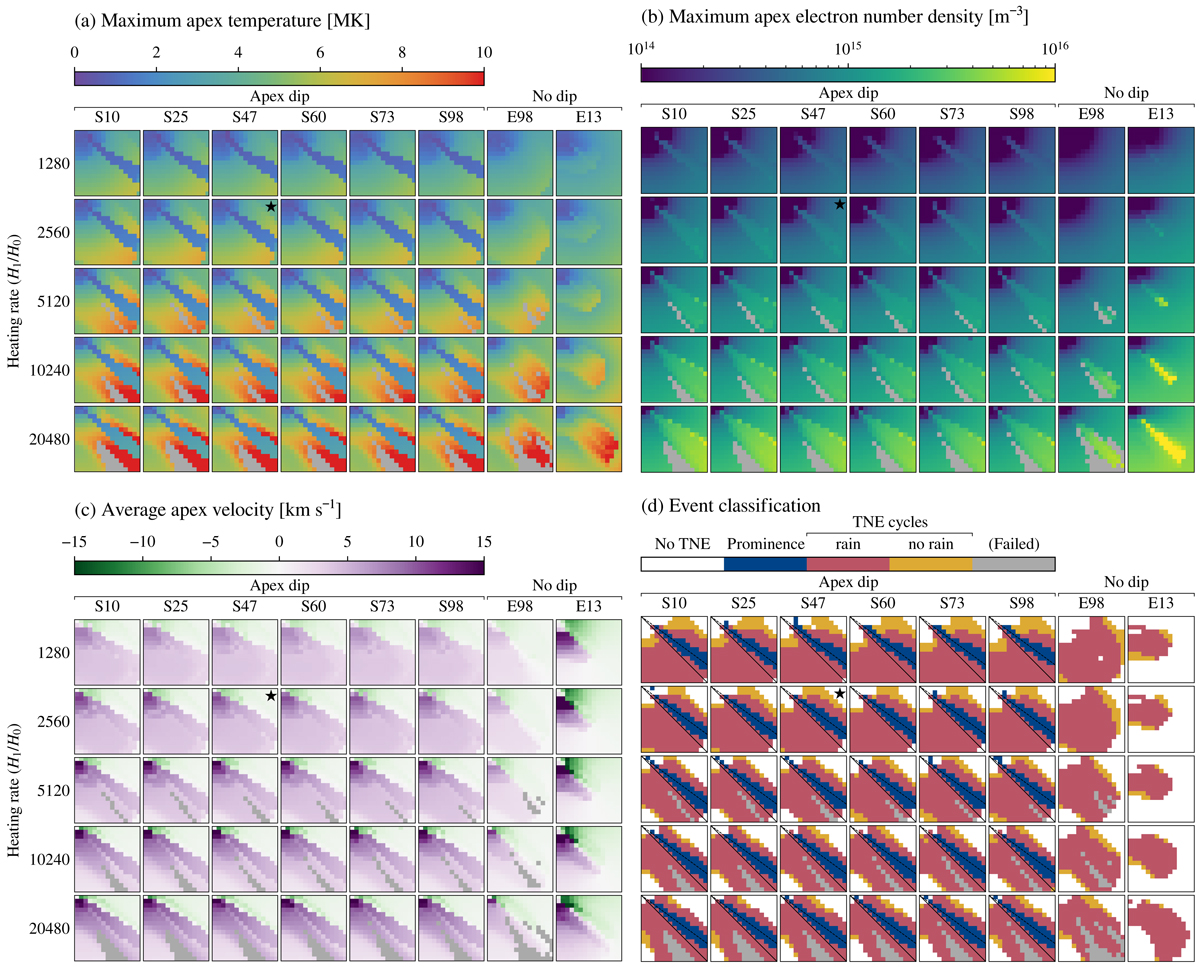
Characteristic quantities for the 9000 simulations of the rain bow. (a) Maximum temperature, (b) maximum electron number density, and (c) average velocity, computed around the loop apex (z > 0.9zmax) during the second half of each simulation (t > 36 h). (d) Event classification: no TNE behaviour (□), formation of a prominence-like structure (![]() ), TNE cycles with (
), TNE cycles with (![]() ) and without (
) and without (![]() ) coronal rain, and simulations that failed because of numerical issues (
) coronal rain, and simulations that failed because of numerical issues (![]() ). Each sub-figure contains 40 squares, corresponding to the eight line geometries (columns), and the five values of H1/H0 (rows). Each square contains 225 simulations for the different values of λ1 (y-axis) and λ2 (x-axis), ranging from 1% of the loop length (top left) to 20% of the loop length (bottom right). The solid lines on (d) correspond to λ1 = λ2. The dashed lines correspond to λ1 = 0.73λ2. The square marked with a star (⋆) corresponds to the 225 simulations shown in Fig. 3a.
). Each sub-figure contains 40 squares, corresponding to the eight line geometries (columns), and the five values of H1/H0 (rows). Each square contains 225 simulations for the different values of λ1 (y-axis) and λ2 (x-axis), ranging from 1% of the loop length (top left) to 20% of the loop length (bottom right). The solid lines on (d) correspond to λ1 = λ2. The dashed lines correspond to λ1 = 0.73λ2. The square marked with a star (⋆) corresponds to the 225 simulations shown in Fig. 3a.
Current usage metrics show cumulative count of Article Views (full-text article views including HTML views, PDF and ePub downloads, according to the available data) and Abstracts Views on Vision4Press platform.
Data correspond to usage on the plateform after 2015. The current usage metrics is available 48-96 hours after online publication and is updated daily on week days.
Initial download of the metrics may take a while.