Fig. 3.
Download original image
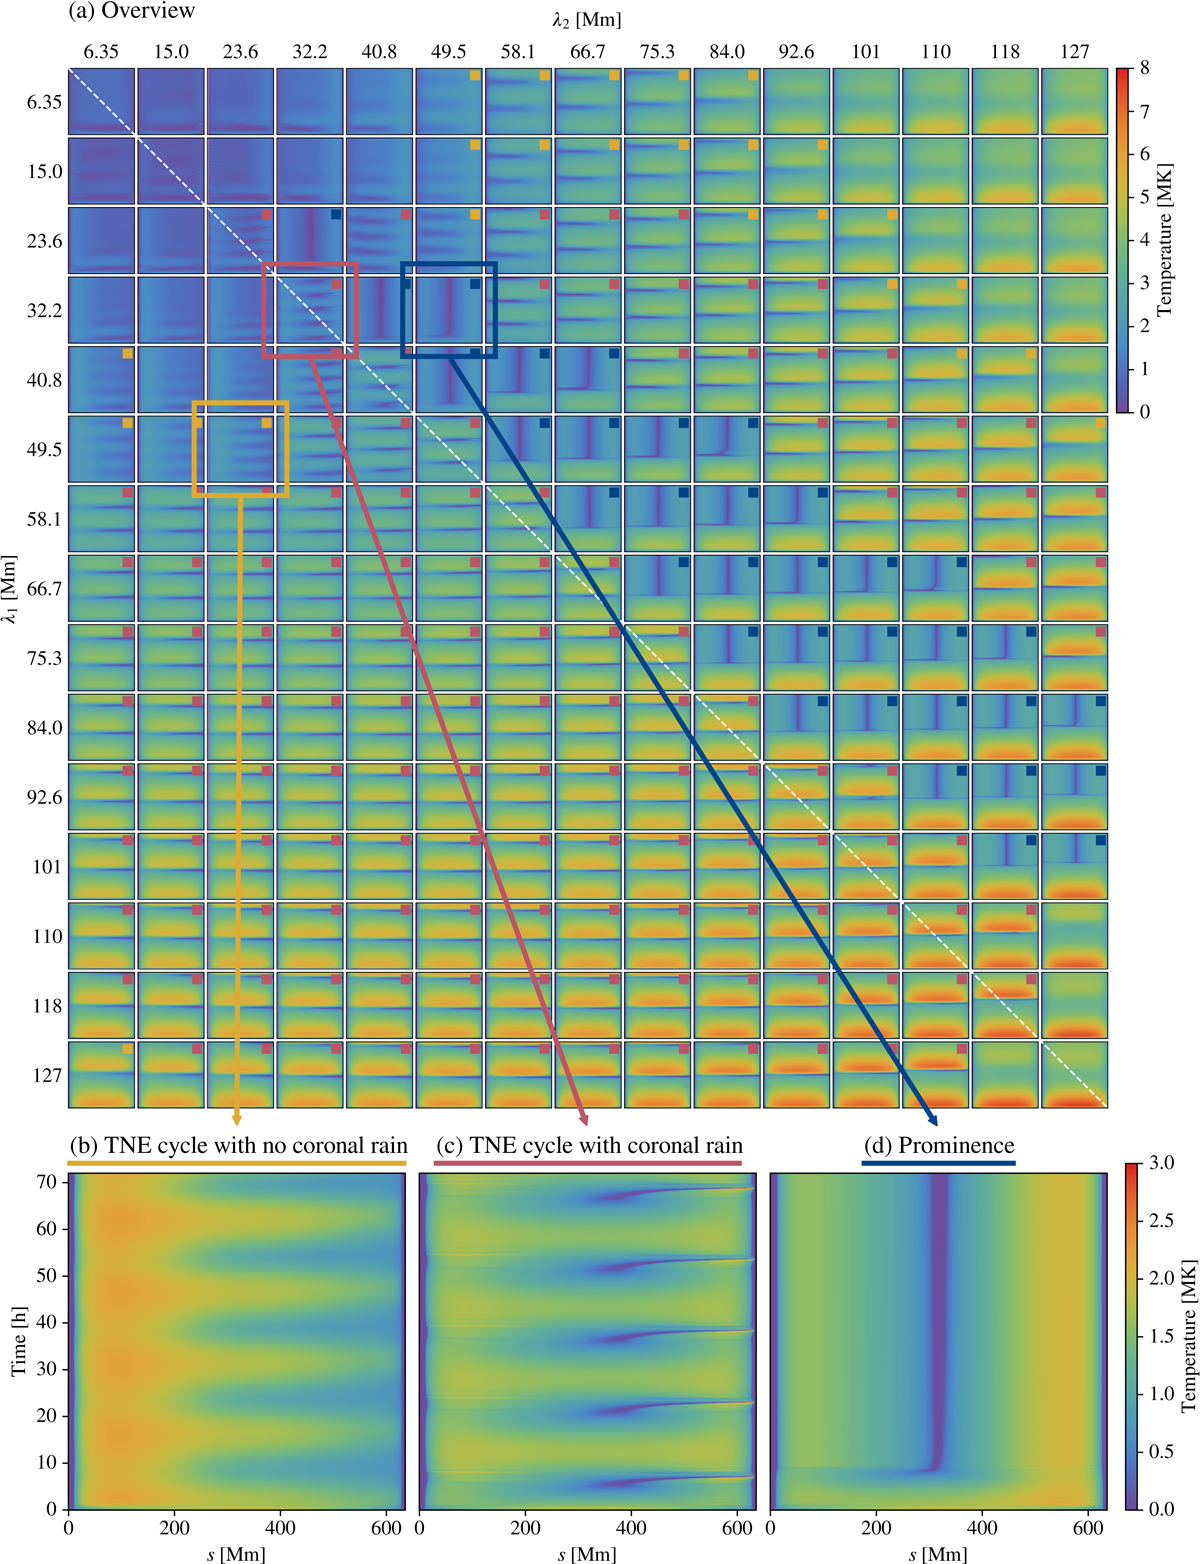
Temperature evolution for the 225 simulations of the rain bow using the geometry S47 (stereoscopically reconstructed shape, with a maximum area expansion Amax = 47), a constant heating rate H0 = 15.5 μW m−3, and a stratified heating rate H1 = 2560H0 = 39.7 μW m−3. (a) Overview of the simulations performed with λ1 and λ2 each varying from 1% to 20% of the loop length L. Each sub-plot shows the evolution of temperature as a function of the position along the loop s (x-axis, ranging from 0 to L = 635.36 Mm) and of time (y-axis, ranging from 0 to 72 h). Event types are marked by coloured squares: TNE cycles with no coronal rain (![]() ), cycles with rain (
), cycles with rain (![]() ), and prominence-like structures (
), and prominence-like structures (![]() ). The white dashed line corresponds to λ1 = λ2. (b) Sample simulation showing TNE cycles without coronal rain. (c) Sample simulation showing TNE cycles with coronal rain. (d) Sample simulation showing the formation of a prominence-like structure.
). The white dashed line corresponds to λ1 = λ2. (b) Sample simulation showing TNE cycles without coronal rain. (c) Sample simulation showing TNE cycles with coronal rain. (d) Sample simulation showing the formation of a prominence-like structure.
Current usage metrics show cumulative count of Article Views (full-text article views including HTML views, PDF and ePub downloads, according to the available data) and Abstracts Views on Vision4Press platform.
Data correspond to usage on the plateform after 2015. The current usage metrics is available 48-96 hours after online publication and is updated daily on week days.
Initial download of the metrics may take a while.