Fig. 2.
Download original image
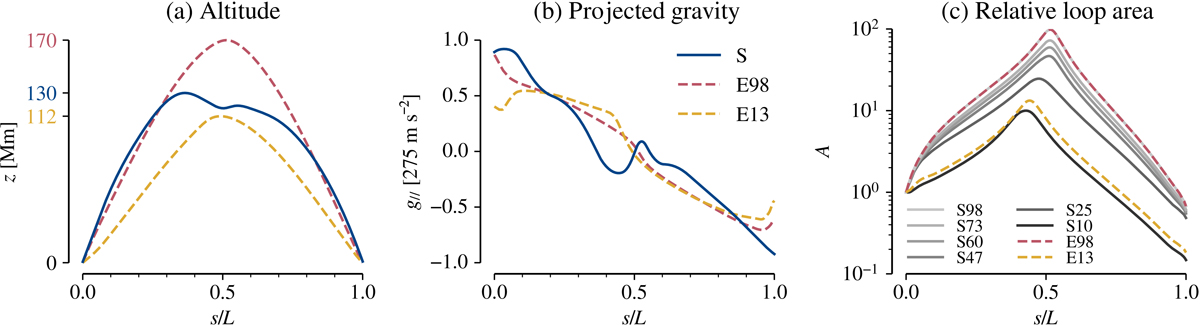
Altitude (a), projected gravity (b), and relative loop cross-sectional area (c) as a function of the position along the loop s divided by the loop length L, for the geometries shown in Fig. 1, and the six loop area profiles generated for the S geometry. The maximum values of the altitude and relative loop area are marked on the corresponding y-axes. The position s = 0 corresponds to the north footpoint of each loop.
Current usage metrics show cumulative count of Article Views (full-text article views including HTML views, PDF and ePub downloads, according to the available data) and Abstracts Views on Vision4Press platform.
Data correspond to usage on the plateform after 2015. The current usage metrics is available 48-96 hours after online publication and is updated daily on week days.
Initial download of the metrics may take a while.