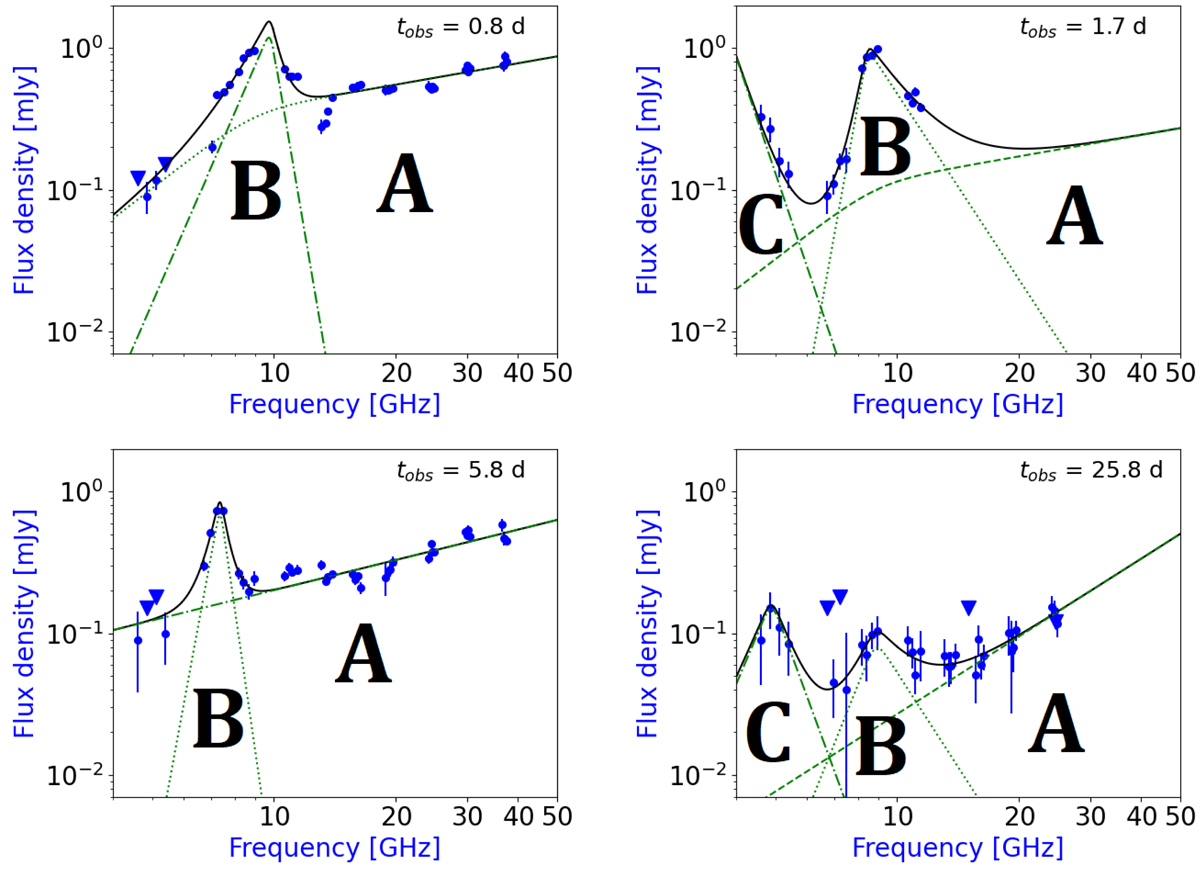
Fig. 5.
Download original image
Radio SEDs of GRB 160131A from 0.8 to 25.8 d in a multi-component approach. Top left: data together with the sum of two BPLs at 0.8 d. Top right: radio data at 1.7 d together with the sum of a SPL and two BPLs. Bottom left: data together with the sum of a SPL and a BPL at 5.8 d. Bottom right: radio SED at 25.8 d fitted with the sum of a SPL and two BPLs. Black lines show the resulting modelling, and green dash-dotted or dotted lines indicate each component. Filled circles indicate detections, and upside-down triangles indicate 3σ upper limits.
Current usage metrics show cumulative count of Article Views (full-text article views including HTML views, PDF and ePub downloads, according to the available data) and Abstracts Views on Vision4Press platform.
Data correspond to usage on the plateform after 2015. The current usage metrics is available 48-96 hours after online publication and is updated daily on week days.
Initial download of the metrics may take a while.