Free Access
Fig. 3.
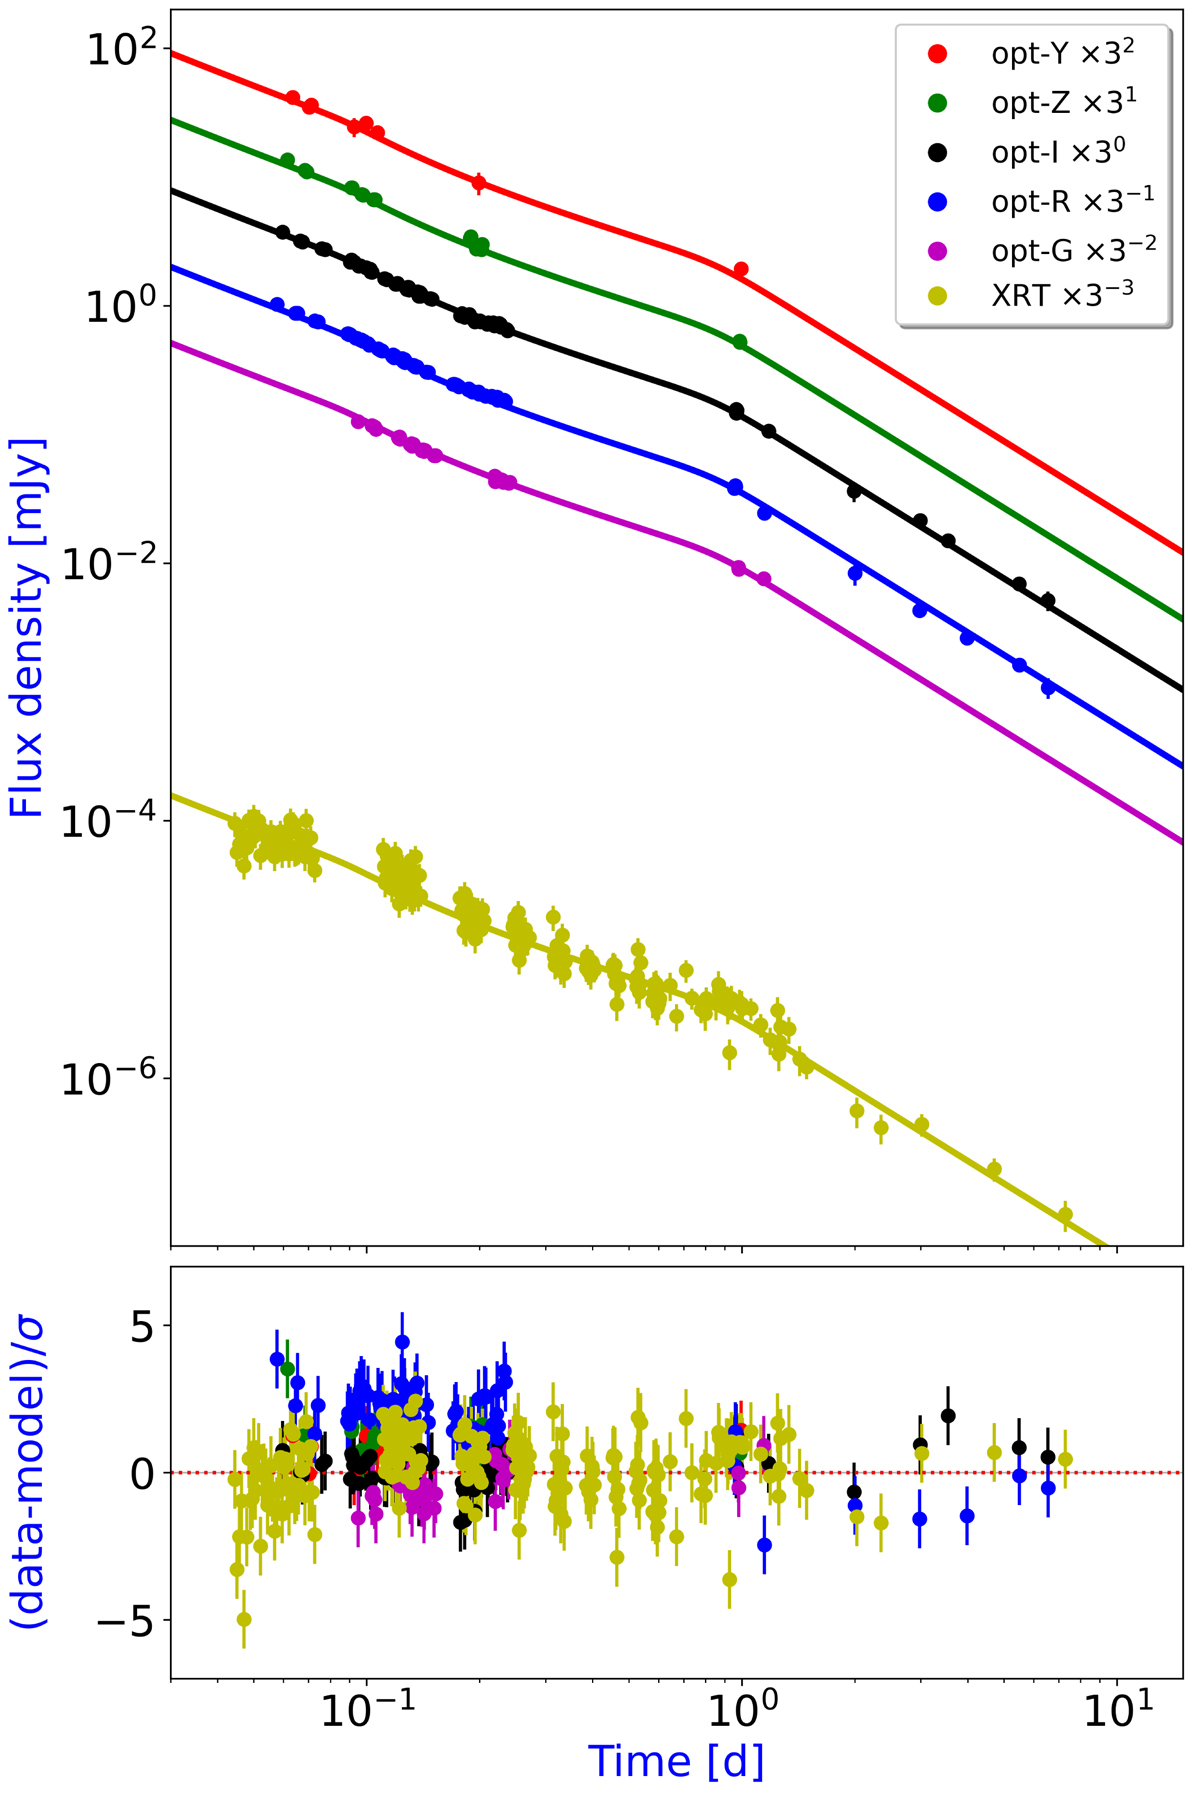
Download original image
Light curves for GRB 160131A of visible and X-ray data modelled with DBPL (Eq. (4)). We observe the plateau, probably ascribable to the energy injection between ∼104 and ∼7 × 10⁴ s (∼0.1 and 0.8 d), and the achromatic break at ∼9 × 10⁴ s (∼1 d), typical of jetted emission. Bottom panel: residuals of the fit.
Current usage metrics show cumulative count of Article Views (full-text article views including HTML views, PDF and ePub downloads, according to the available data) and Abstracts Views on Vision4Press platform.
Data correspond to usage on the plateform after 2015. The current usage metrics is available 48-96 hours after online publication and is updated daily on week days.
Initial download of the metrics may take a while.