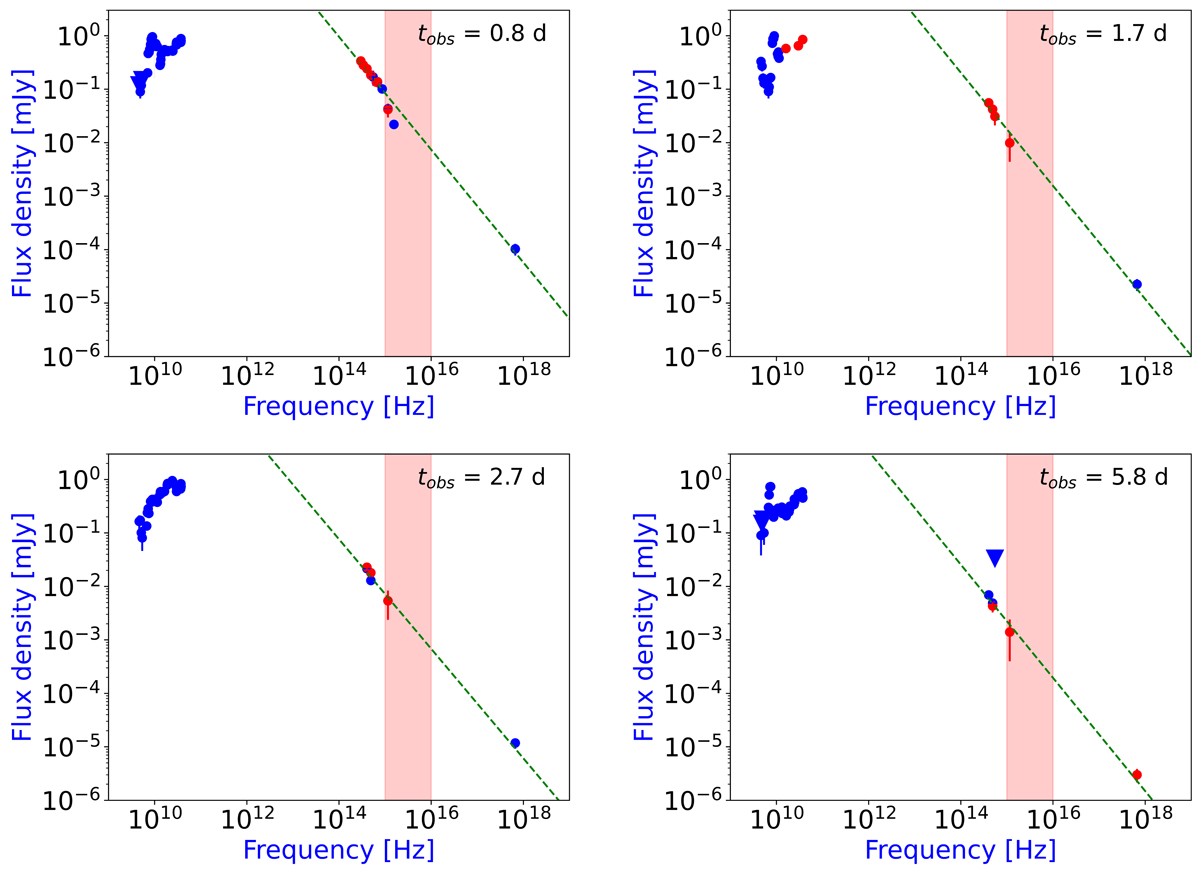
Fig. 2.
Download original image
Broadband SEDs of GRB 160131A at 0.8 d (top left), 1.7 d (top right), 2.7 d (bottom left), and 5.8 d (bottom right). Blue (red) points are measured (linearly interpolated in a log-log plot) data. These SEDs display radio peaks (at 0.8 d, 1.7 d, and 5.8 d) and dust extinction (red shaded regions, especially at 0.8 d). The green dashed line shows the resulting modelling of the high-energy data (optical/X-ray). Filled circles indicate detections, and upside-down triangles indicate 3σ upper limits.
Current usage metrics show cumulative count of Article Views (full-text article views including HTML views, PDF and ePub downloads, according to the available data) and Abstracts Views on Vision4Press platform.
Data correspond to usage on the plateform after 2015. The current usage metrics is available 48-96 hours after online publication and is updated daily on week days.
Initial download of the metrics may take a while.