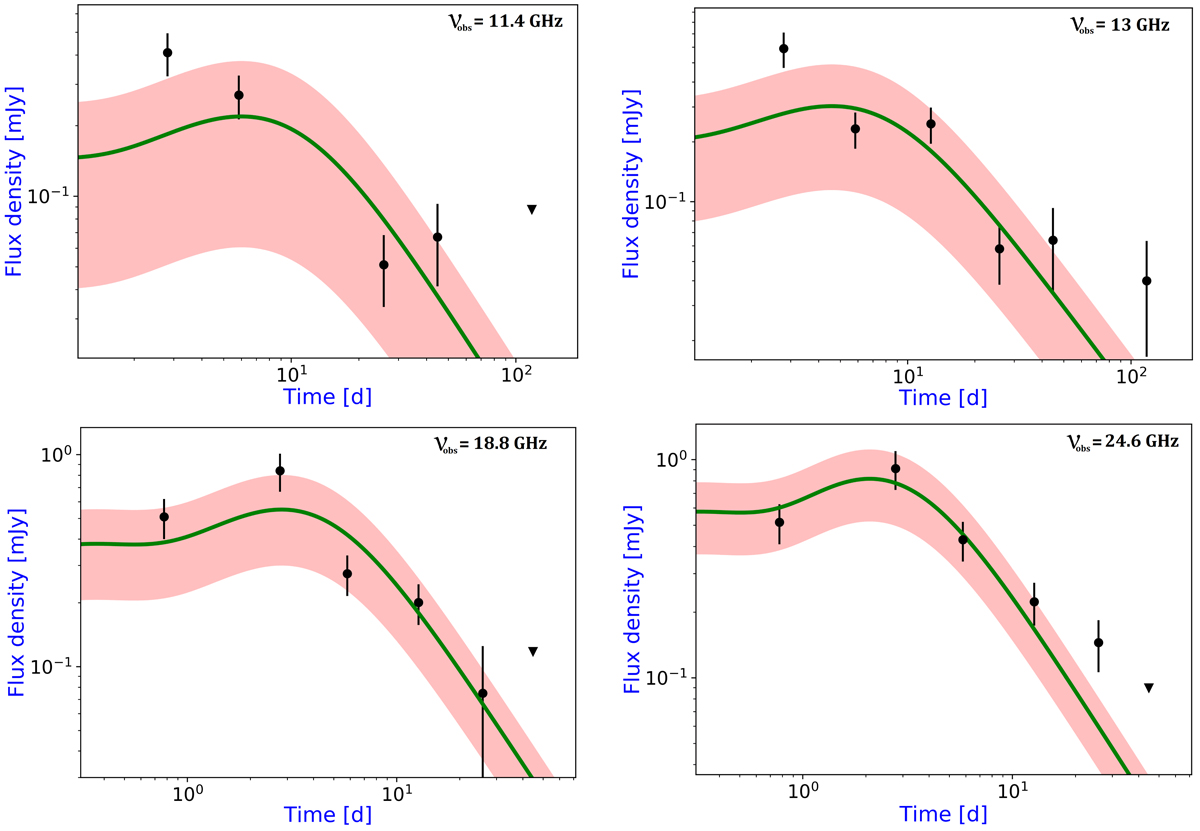
Fig. 16.
Download original image
Radio light curves of GRB 160131A at 11.4 GHz (top left), 13 GHz (top right), 18.8 GHz (bottom left), and 24.6 GHz (bottom right), obtained through a radio modelling (from radio to X-ray frequencies) for a FS model in ISM; we considered a jetted (edge-regime) emission with ISS effect, dust extinction and energy injection. Filled circles indicate detections, and upside-down triangles indicate 3σ upper limits; the red shaded regions represent the expected variability due to the ISS effect obtained through the prescription described in Misra et al. (2021).
Current usage metrics show cumulative count of Article Views (full-text article views including HTML views, PDF and ePub downloads, according to the available data) and Abstracts Views on Vision4Press platform.
Data correspond to usage on the plateform after 2015. The current usage metrics is available 48-96 hours after online publication and is updated daily on week days.
Initial download of the metrics may take a while.