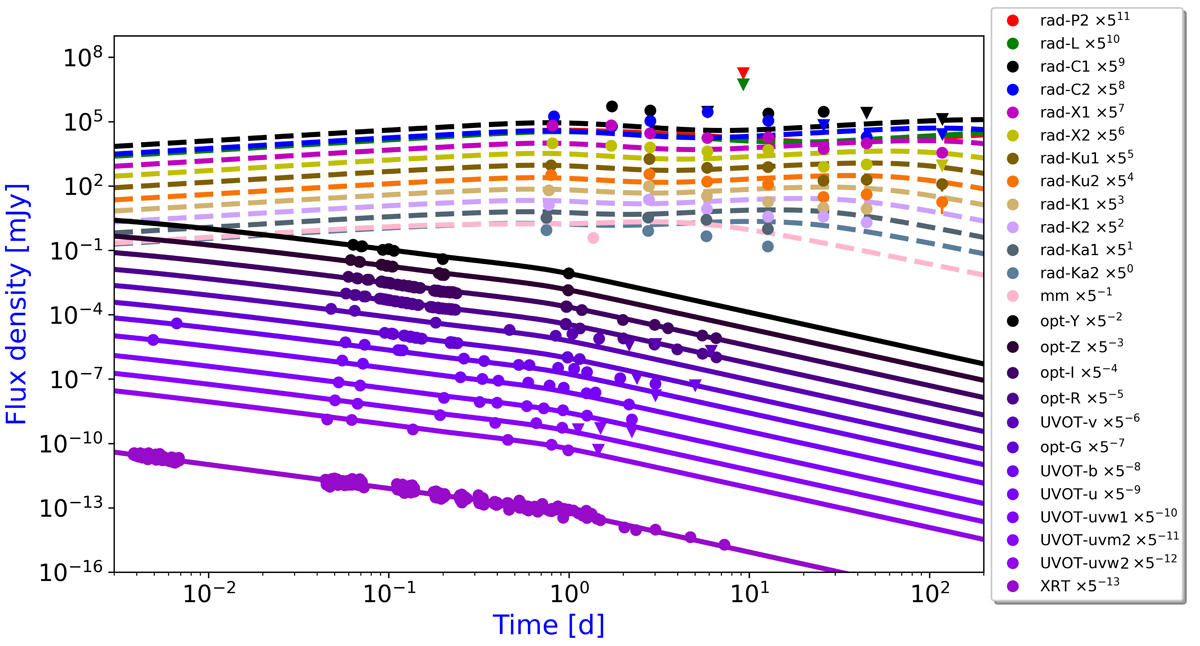
Fig. 11.
Download original image
Broadband modelling (from optical to X-ray frequencies; Table 5, second column) of GRB 160131A. See the caption of Fig. 7 for a full description of the modelling. Filled circles indicate detections, and downward triangles indicate 3σ upper limits. For completeness we include all the radio data (dashed lines, not modelled in this approach) and relative light curves (derived from optical/X-ray modelling).
Current usage metrics show cumulative count of Article Views (full-text article views including HTML views, PDF and ePub downloads, according to the available data) and Abstracts Views on Vision4Press platform.
Data correspond to usage on the plateform after 2015. The current usage metrics is available 48-96 hours after online publication and is updated daily on week days.
Initial download of the metrics may take a while.