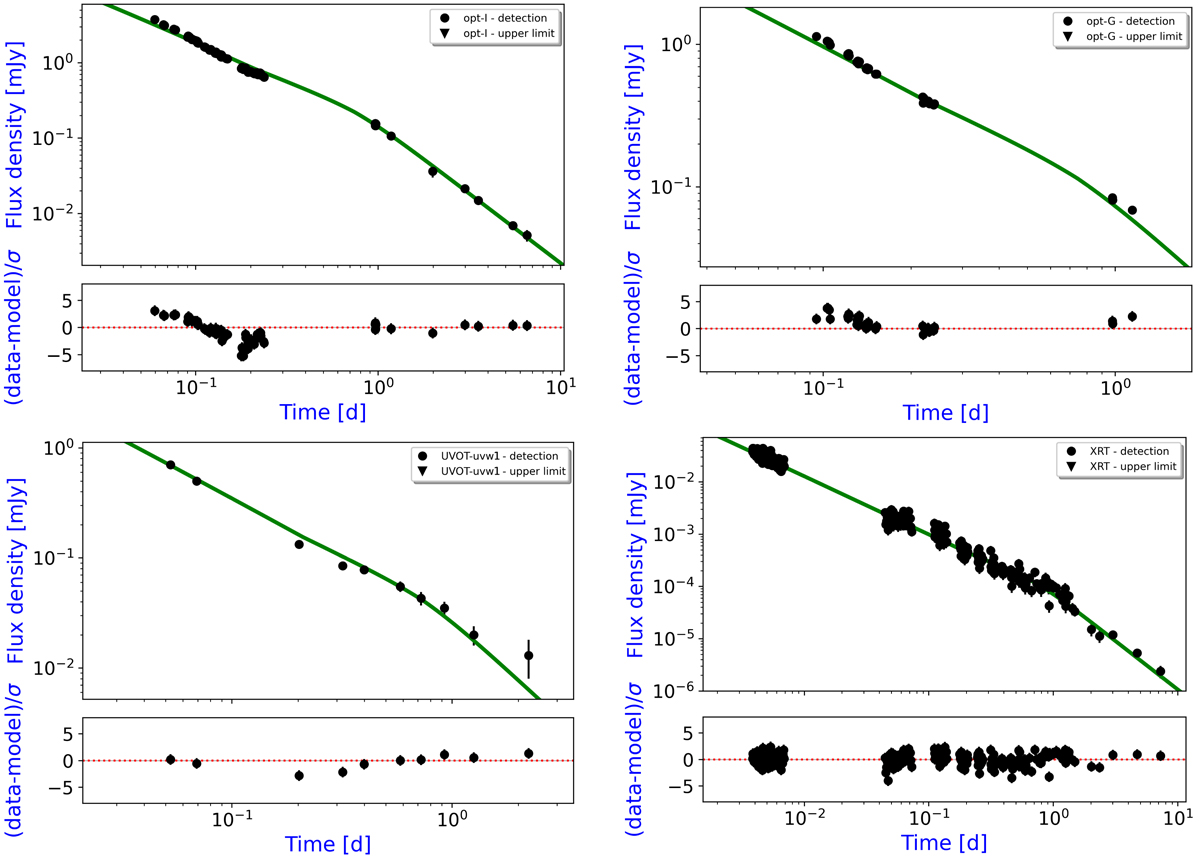
Fig. 10.
Download original image
Light curves of GRB 160131A in the UVOIR/X-rays domain at i′-filter (4.03 × 10¹⁴, top left), g′-filter (6.47 × 10¹⁴, top right), UV/uvw1-filter (1.15 × 10¹⁵, bottom left), and X-ray frequency (6.65 × 10¹⁷, bottom right), referred to the broadband modelling from optical to X-ray frequencies (Table 5, second column), displayed in Fig. 8. The bottom panel of each light curve corresponds to the residuals of the fit. See the caption of Fig. 7 for a full description of the modelling. Filled circles indicate detections, upside down triangles indicate 3σ upper limits, and green lines show the resulting model.
Current usage metrics show cumulative count of Article Views (full-text article views including HTML views, PDF and ePub downloads, according to the available data) and Abstracts Views on Vision4Press platform.
Data correspond to usage on the plateform after 2015. The current usage metrics is available 48-96 hours after online publication and is updated daily on week days.
Initial download of the metrics may take a while.