Fig. 1.
Download original image
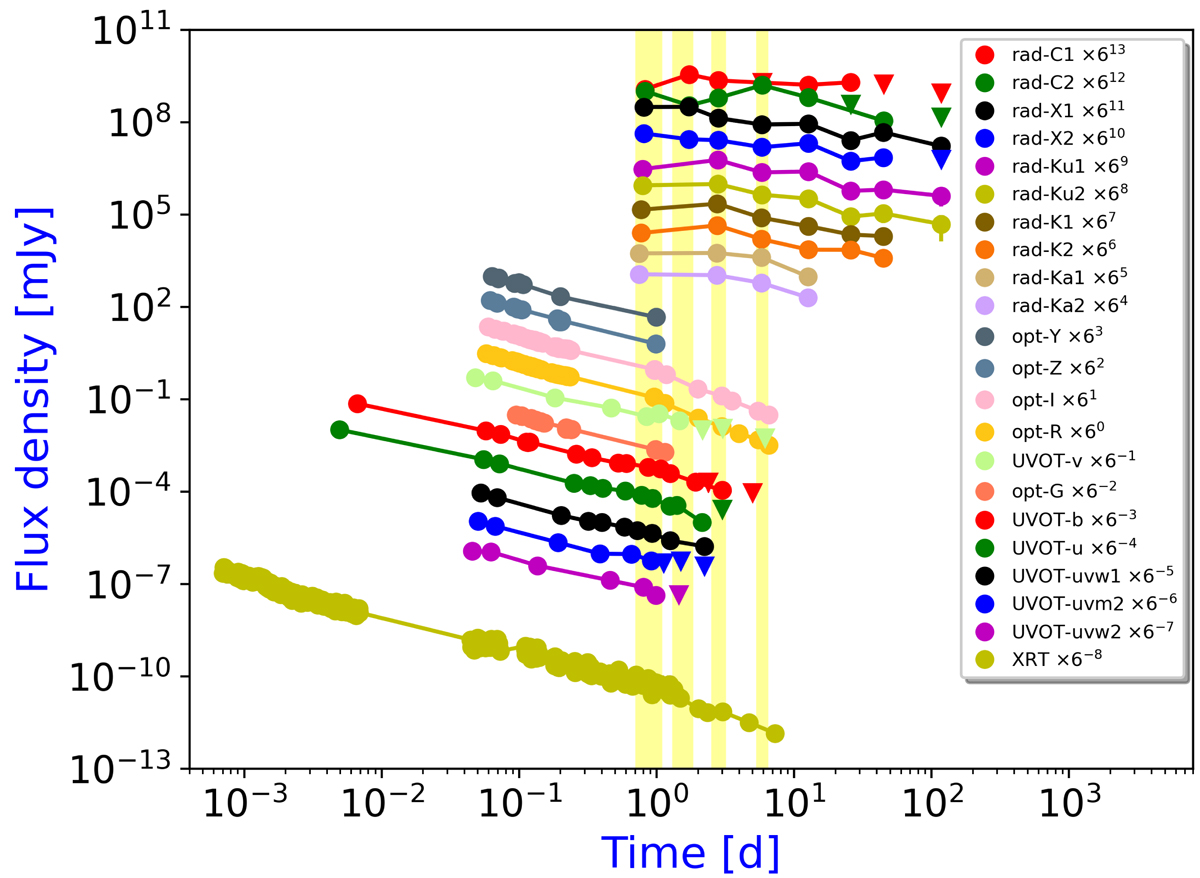
GRB 160131A light curves from radio to X-rays. Yellow shaded areas show the time intervals (centred to 0.8 d, 1.7 d, 2.7 d, and 5.8 d) where SEDs have been empirically analysed. Filled circles indicate detections (uncertainties are smaller than the corresponding symbol sizes), which are connected with each other through a segment, and upside down triangles indicate 3σ upper limits.
Current usage metrics show cumulative count of Article Views (full-text article views including HTML views, PDF and ePub downloads, according to the available data) and Abstracts Views on Vision4Press platform.
Data correspond to usage on the plateform after 2015. The current usage metrics is available 48-96 hours after online publication and is updated daily on week days.
Initial download of the metrics may take a while.