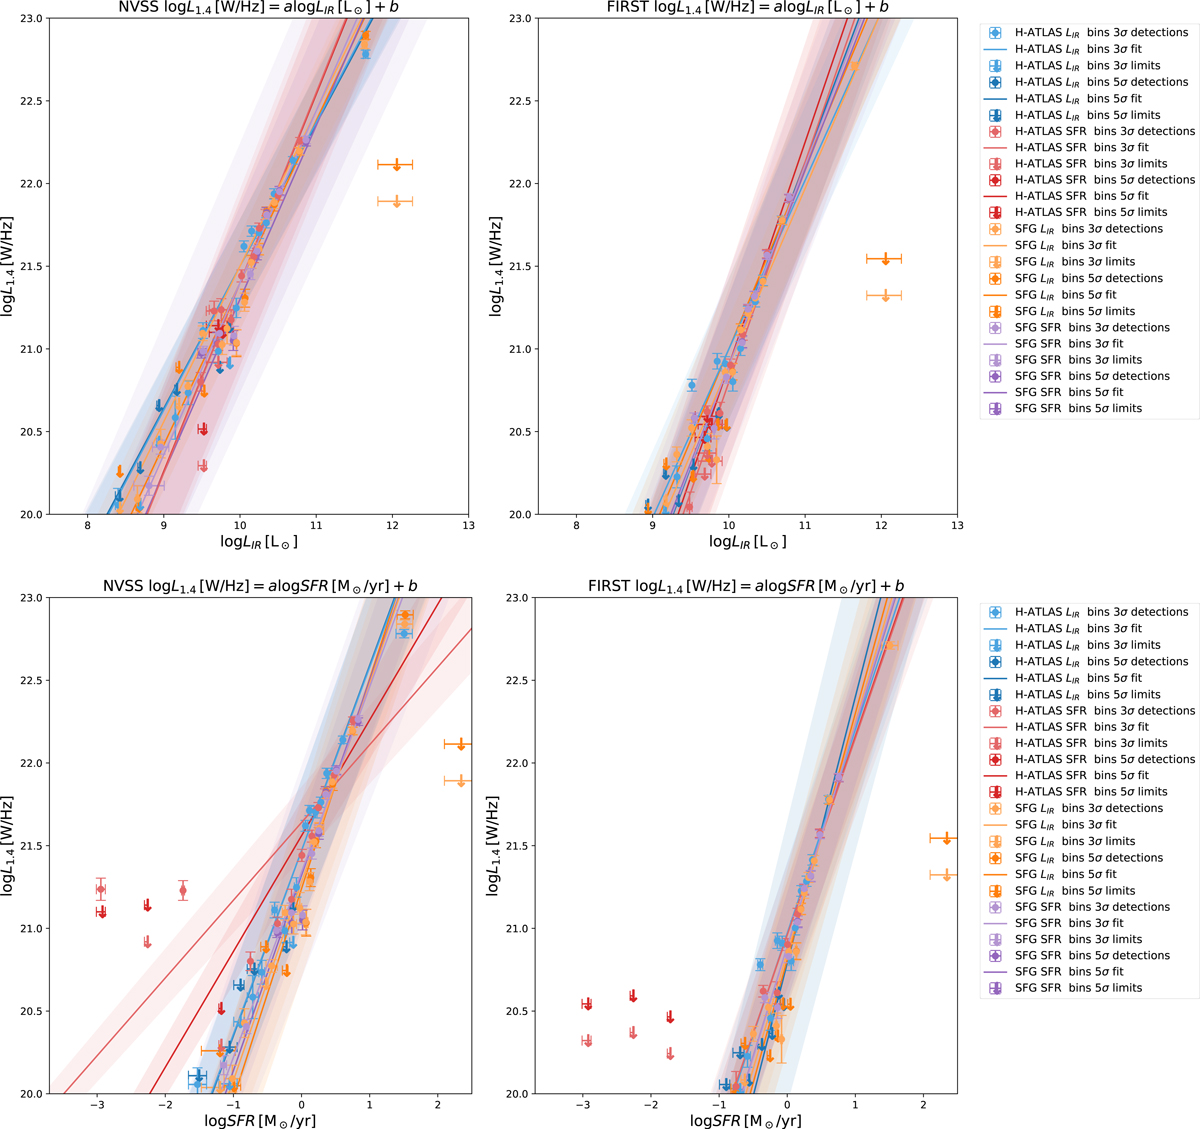
Fig. 7.
Download original image
Best-fitting lines from Table 2 for which the relative errors on the two parameters a and b are lower than 20%. Solid lines represent the best-fitting relations for each sample, listed in Table 2, while their corresponding confidence intervals are shown by the shaded bands. The left panels show results for the NVSS cutouts, and the right panels show the results for the FIRST cutouts. Detections are marked with points, and arrows are used to show nondetections, both with accompanying error bars on both axes.
Current usage metrics show cumulative count of Article Views (full-text article views including HTML views, PDF and ePub downloads, according to the available data) and Abstracts Views on Vision4Press platform.
Data correspond to usage on the plateform after 2015. The current usage metrics is available 48-96 hours after online publication and is updated daily on week days.
Initial download of the metrics may take a while.