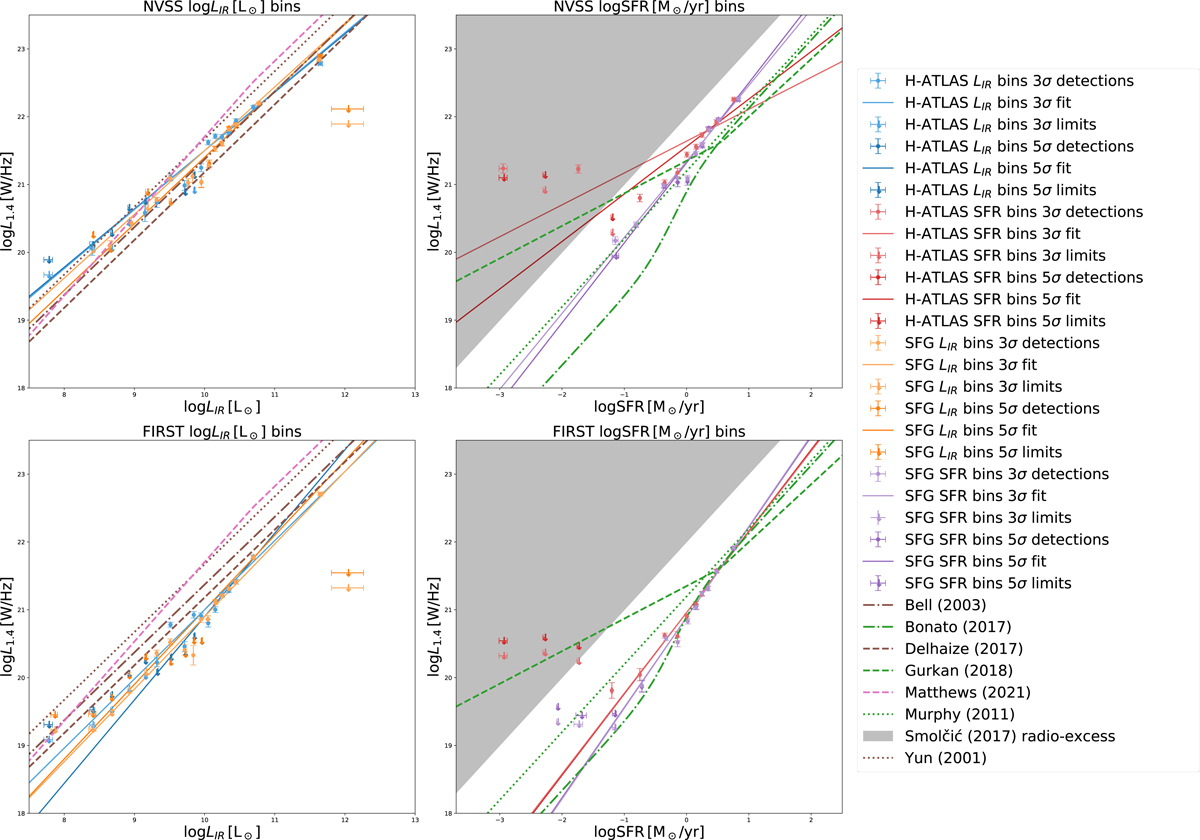
Fig. 6.
Download original image
Radio luminosity density log L1.4 derived for bins of IR luminosity (left panels) and SFR (right panels), with their error bars and best-fitting lines listed in Table 2. Upper limits are shown as arrows corresponding in color to detections (points). The top row refers to NVSS cutouts, and the bottom row shows FIRST cutouts. Non-SFG samples, i.e., samples not cleaned using the Smolčić et al. (2017) criterion (excluded region shown as a shaded interval), show a strong radio luminosity excess at a given SFR due to the presence of RL AGNs.
Current usage metrics show cumulative count of Article Views (full-text article views including HTML views, PDF and ePub downloads, according to the available data) and Abstracts Views on Vision4Press platform.
Data correspond to usage on the plateform after 2015. The current usage metrics is available 48-96 hours after online publication and is updated daily on week days.
Initial download of the metrics may take a while.