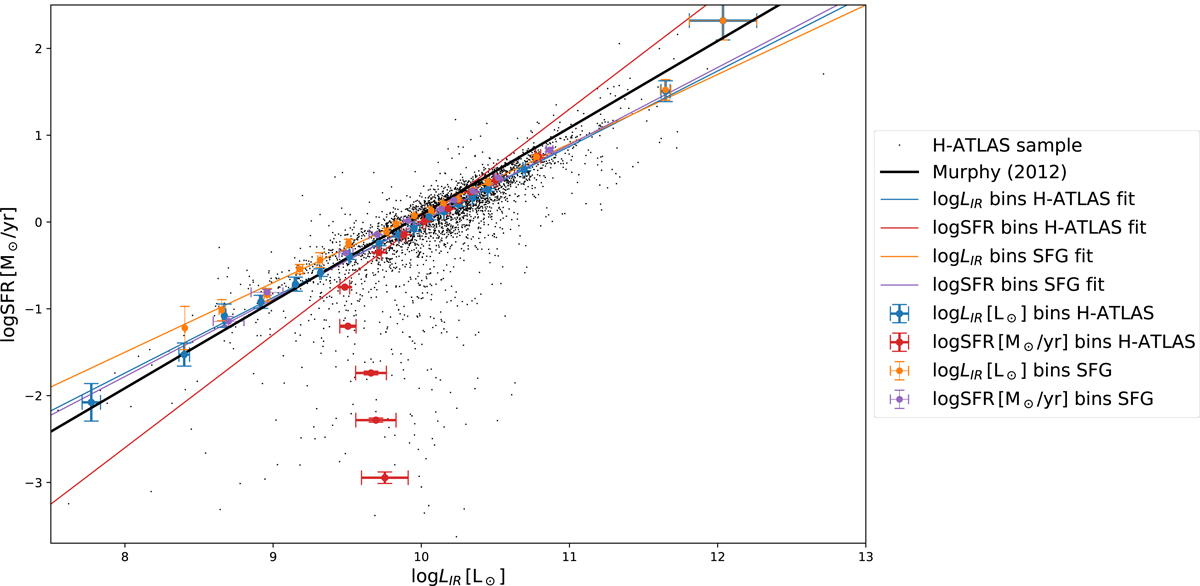
Fig. 5.
Download original image
Relation between SFR and LIR for various (sub) samples, with their respective error bars. The various samples are identified in the legend by the binning strategy (LIR and SFR bins) and by the respective sample type (H-ATLAS and SFG). Solid lines represent the best-fitting relations for each sample, listed in Table 2, and correspond in color to the data points. The black dots represent SFR and LIR for individual sources in the H-ATLAS sample.
Current usage metrics show cumulative count of Article Views (full-text article views including HTML views, PDF and ePub downloads, according to the available data) and Abstracts Views on Vision4Press platform.
Data correspond to usage on the plateform after 2015. The current usage metrics is available 48-96 hours after online publication and is updated daily on week days.
Initial download of the metrics may take a while.