Fig. 4.
Download original image
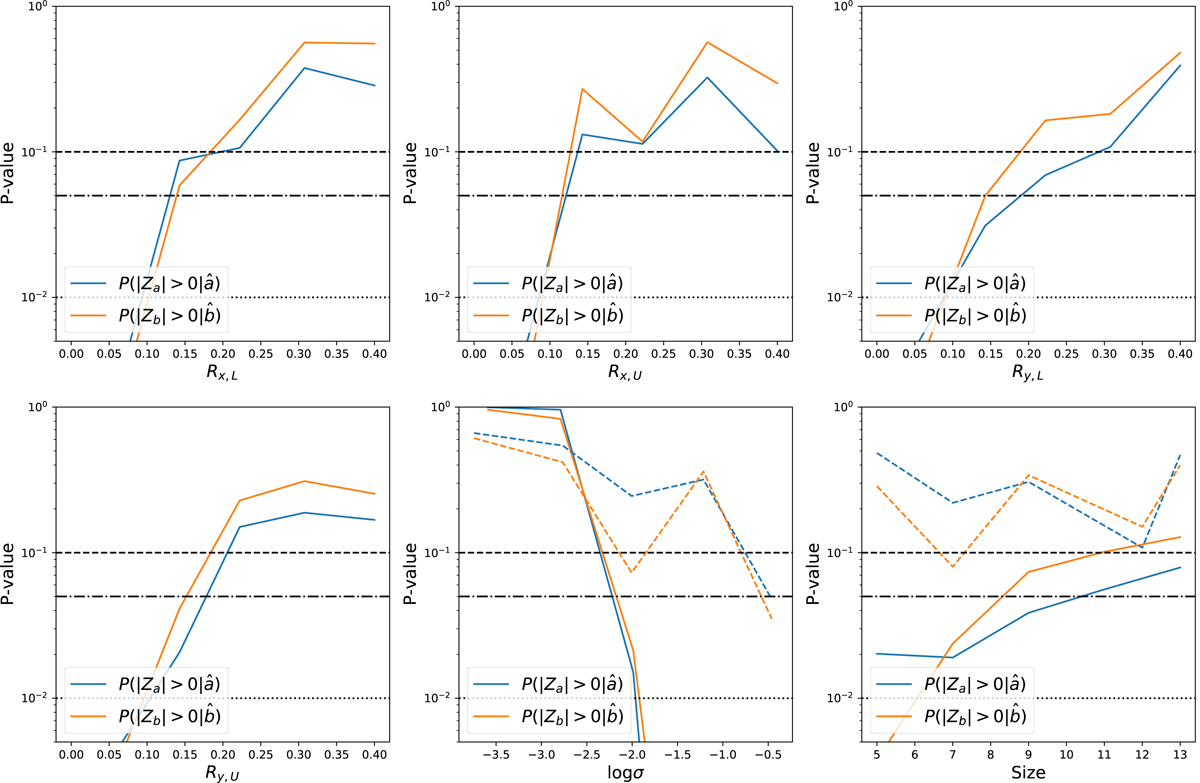
P-values for the differences between the Monte Carlo simulated linear model parameters and their corresponding simulation inputs. The blue lines show the P-values computed using the Z-scores of the differences between the simulated, a, and input slopes, ![]() , and the orange lines show the P-values computed for the simulated intercept. The bins are the same as in Fig. 3 (see Sect. 3.2 for details). The dashed, dot-dashed, and dotted black lines show the 10%, 5%, and 1% confidence limits, respectively, as reference.
, and the orange lines show the P-values computed for the simulated intercept. The bins are the same as in Fig. 3 (see Sect. 3.2 for details). The dashed, dot-dashed, and dotted black lines show the 10%, 5%, and 1% confidence limits, respectively, as reference.
Current usage metrics show cumulative count of Article Views (full-text article views including HTML views, PDF and ePub downloads, according to the available data) and Abstracts Views on Vision4Press platform.
Data correspond to usage on the plateform after 2015. The current usage metrics is available 48-96 hours after online publication and is updated daily on week days.
Initial download of the metrics may take a while.