Fig. 3.
Download original image
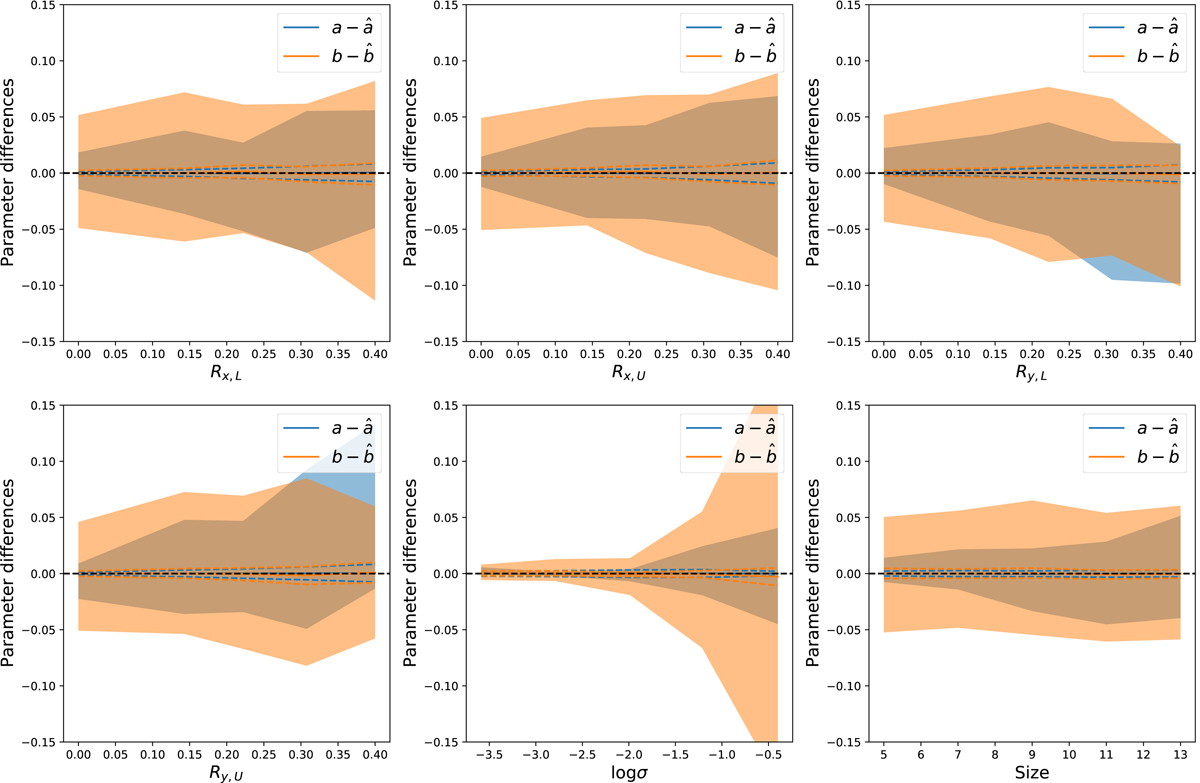
Differences between the Monte Carlo simulated linear model parameters and the corresponding simulation inputs. The results are shown for bins in the ratio of the number of upper and lower limits on the x- and y-axes (Rx, L, Rx, U, Ry, L, and Ry, U) as well as for bins of the dispersion σ and of the size of the sample (see Sect. 3.2 for details). The blue lines show the median differences between the simulated, a, and input slopes, ![]() , and the orange lines show the same difference for the simulated intercept, b, and its input in the simulation,
, and the orange lines show the same difference for the simulated intercept, b, and its input in the simulation, ![]() . The shaded intervals are the intervals between the 16th and 84th percentile in each bin.
. The shaded intervals are the intervals between the 16th and 84th percentile in each bin.
Current usage metrics show cumulative count of Article Views (full-text article views including HTML views, PDF and ePub downloads, according to the available data) and Abstracts Views on Vision4Press platform.
Data correspond to usage on the plateform after 2015. The current usage metrics is available 48-96 hours after online publication and is updated daily on week days.
Initial download of the metrics may take a while.