Free Access
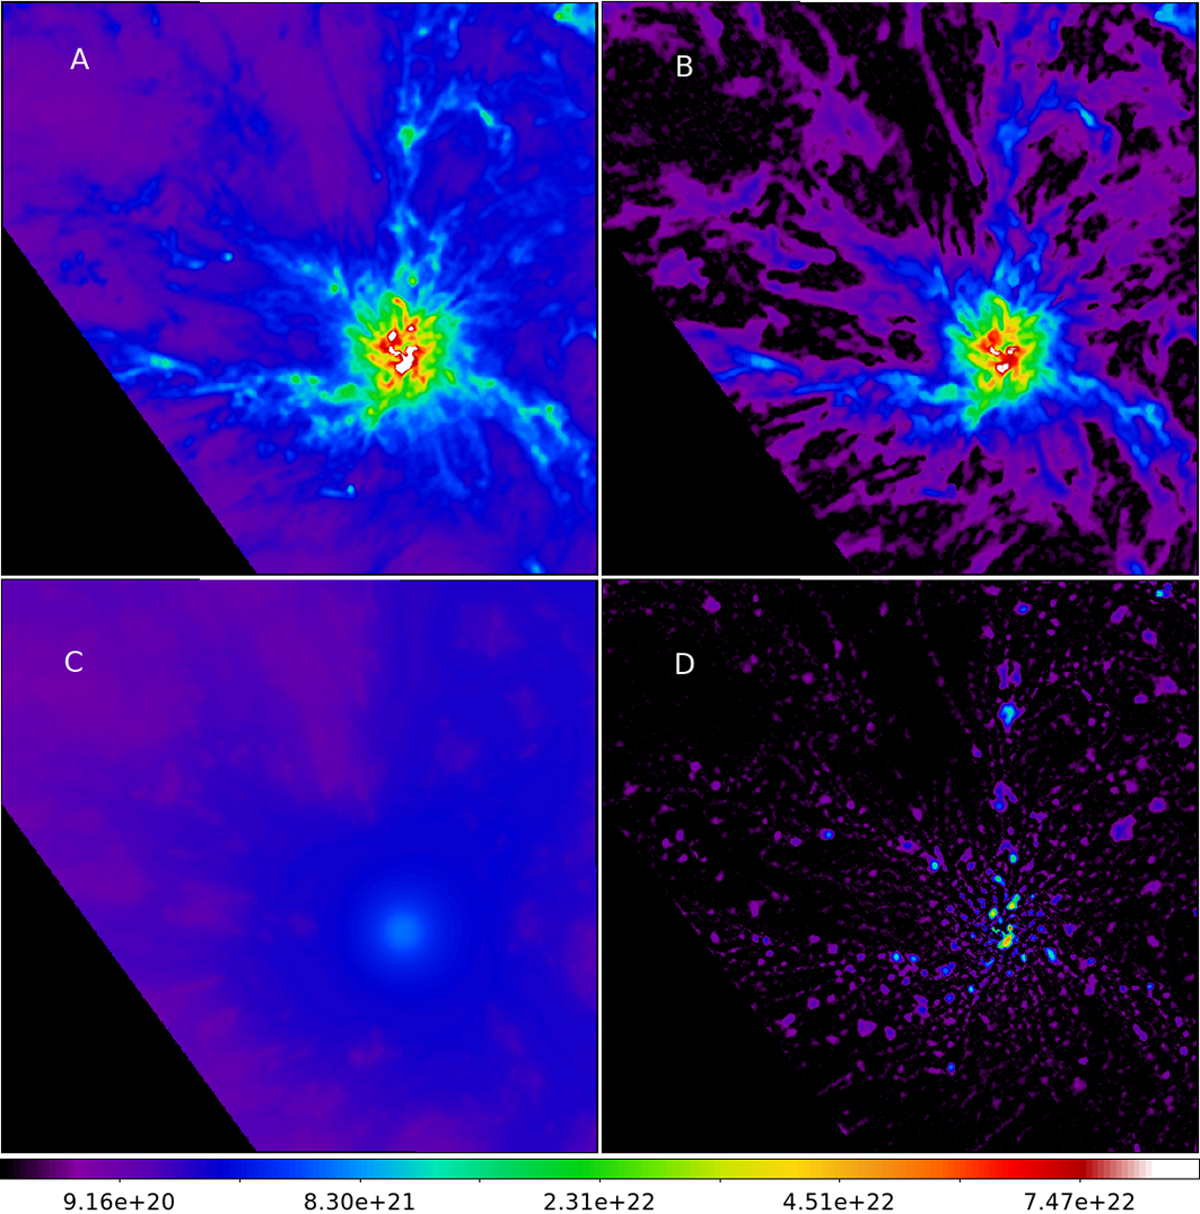
Fig. A.1
Download original image
Structural component decomposition. The images shown are: a) Herschel column density map at 18.2′′, b) filaments, c) extended background, and d) sources. The total flux in the image area is conserved with the column density maprepresenting a sum of its structural components. The colour bar is common to all panels.
Current usage metrics show cumulative count of Article Views (full-text article views including HTML views, PDF and ePub downloads, according to the available data) and Abstracts Views on Vision4Press platform.
Data correspond to usage on the plateform after 2015. The current usage metrics is available 48-96 hours after online publication and is updated daily on week days.
Initial download of the metrics may take a while.