Fig. 8
Download original image
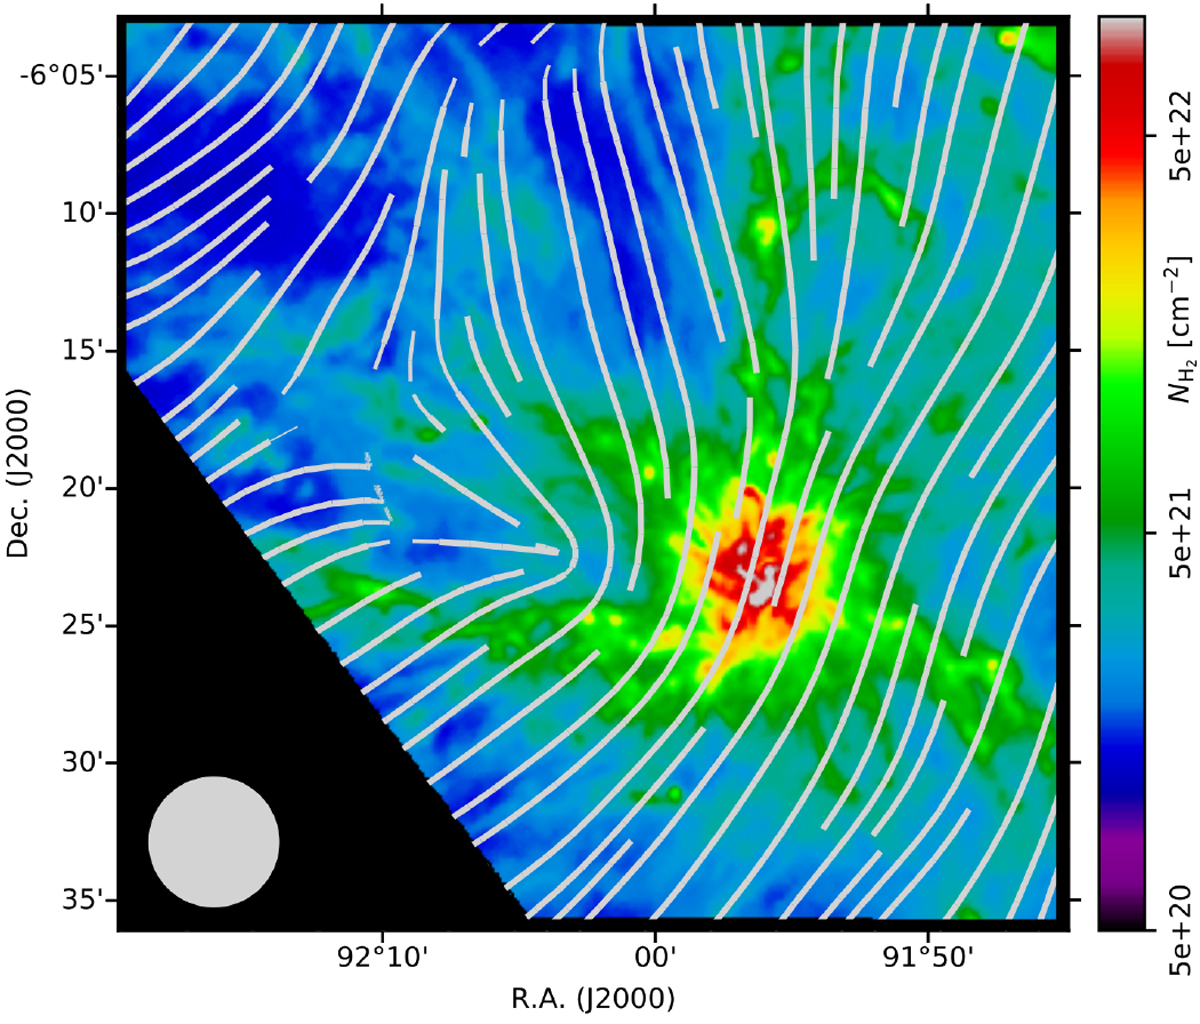
Herschel column density map at 18.2′′ resolution overlaid by grey streamlines displaying the plane of the sky B fields which were computed using the 353 GHz observationsfrom the Planck mission. Thespatial resolution of the Planck data is 4.9′ (as shown by the grey circle in the lower left of the image). The Stokes Q and U components were used to obtain the B-field position angles. The results are displayed as grey streamlines by using streamplot in matplotlib, as thicker lines for the signal-to-noise ratio, S∕N > 2.5, and thinner ones for 2.0 < S∕N < 2.5.
Current usage metrics show cumulative count of Article Views (full-text article views including HTML views, PDF and ePub downloads, according to the available data) and Abstracts Views on Vision4Press platform.
Data correspond to usage on the plateform after 2015. The current usage metrics is available 48-96 hours after online publication and is updated daily on week days.
Initial download of the metrics may take a while.