Fig. 7
Download original image
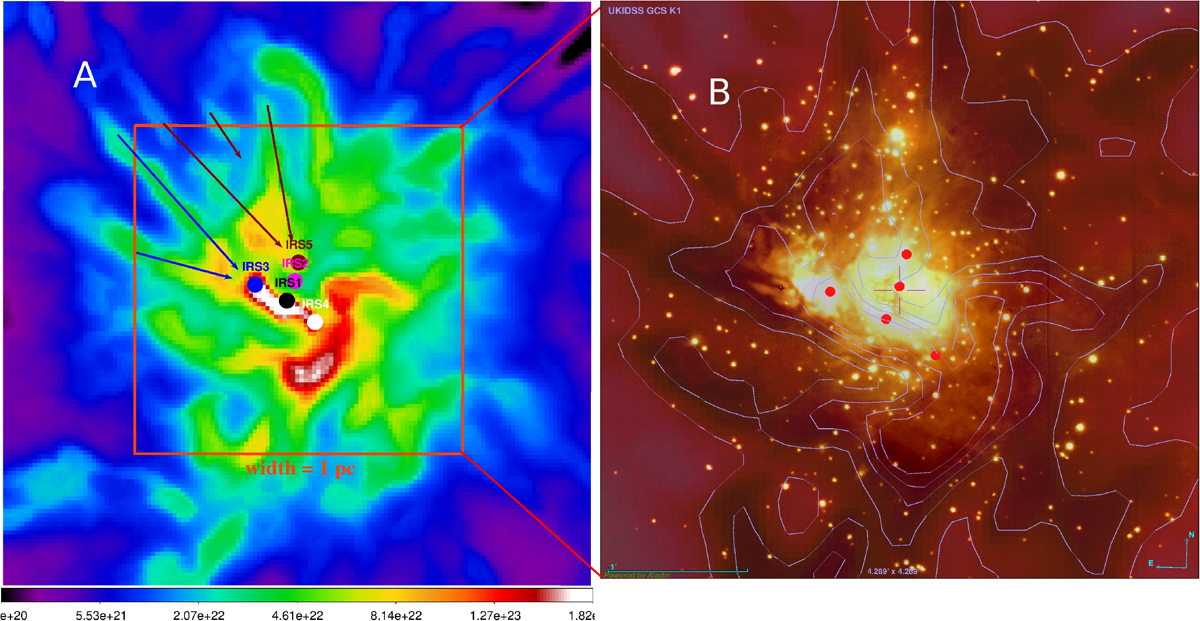
Hub is a high-density filament network along which massive stars form. Left: column density of the filament component of the hub region at 11.4′′ resolution. The most massive sources known in the region, namely IRS1, IRS2, IRS3, IRS4, and IRS5, are marked. The blue and maroon arrows indicate the filaments leading to the junctions in whichIRS3 and IRS5 are embedded, respectively. The red square corresponds to the cluster (radius = 0.5pc) (Carpenter et al. 1997), which is zoomed in on in the right panel. Right: deep K band (2 μm) image overlaid with contours of the filament column density image shown in the left panel. Readers should notice the striking correspondence between the infrared dark patches and the column density contours. The IRS sources are marked by red dots.
Current usage metrics show cumulative count of Article Views (full-text article views including HTML views, PDF and ePub downloads, according to the available data) and Abstracts Views on Vision4Press platform.
Data correspond to usage on the plateform after 2015. The current usage metrics is available 48-96 hours after online publication and is updated daily on week days.
Initial download of the metrics may take a while.