Fig. 6
Download original image
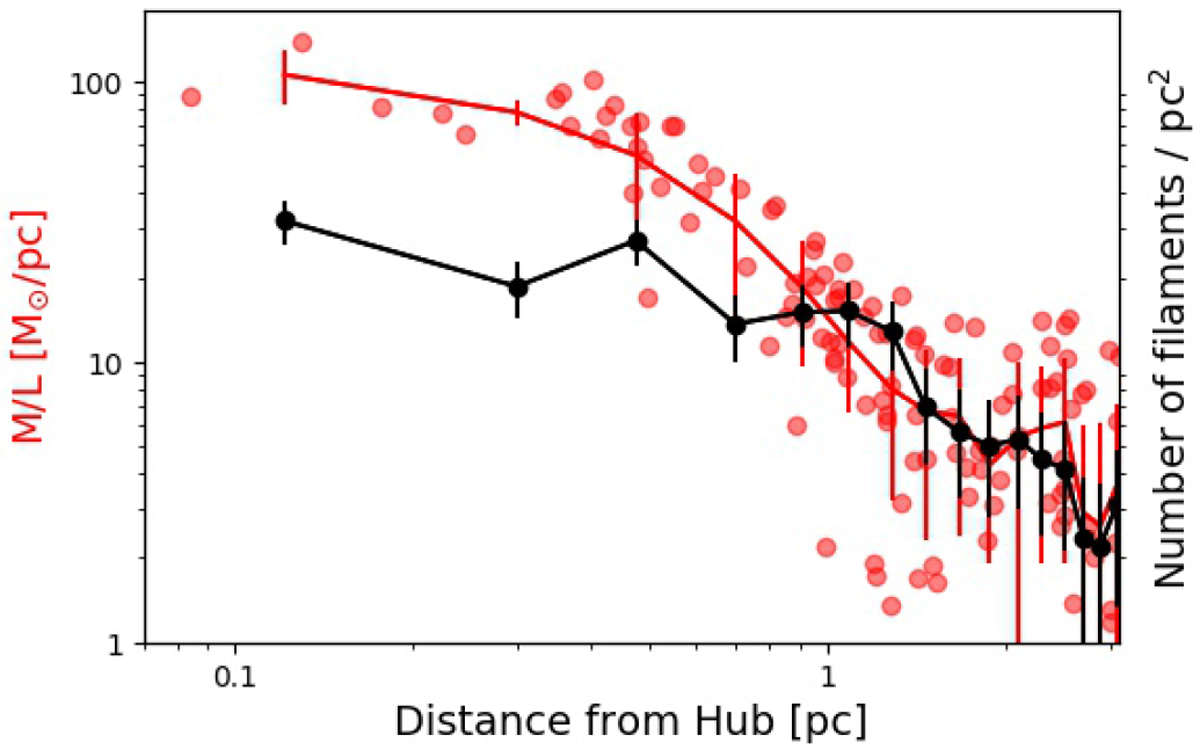
Different version of Fig. 5 where the number of filaments per unit area (N) is compared with the M∕L. Readers should notice that while both the M∕L and N increase with decreasing distance from the hub centre from 3 pc to 1 pc, in the region within 1 pc, N flattens outwhile M/L steeply continues to increase with decreasing distance before flattening out in the central 0.2–0.3 pc.
Current usage metrics show cumulative count of Article Views (full-text article views including HTML views, PDF and ePub downloads, according to the available data) and Abstracts Views on Vision4Press platform.
Data correspond to usage on the plateform after 2015. The current usage metrics is available 48-96 hours after online publication and is updated daily on week days.
Initial download of the metrics may take a while.