Fig. 5
Download original image
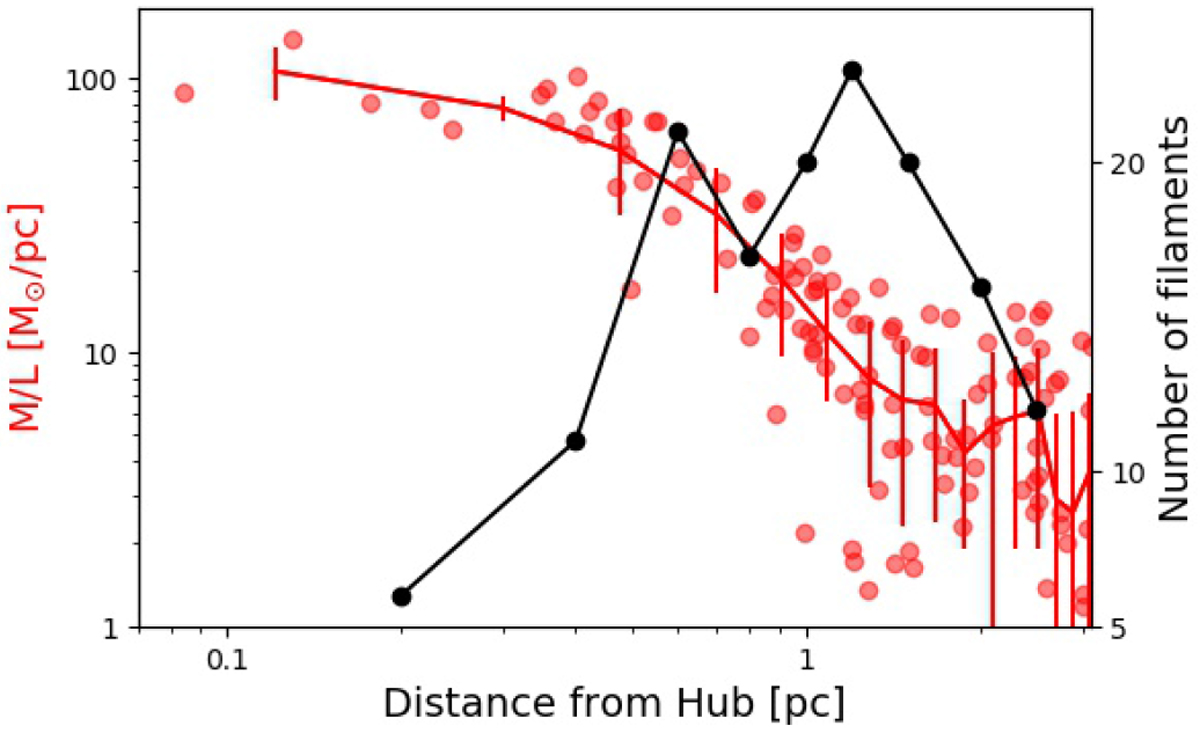
Radial variation of filament M∕L (red) and the number of filaments crossing annular circles (black). Red dots show the actual data points for all skeletons longer than 0.4 pc. The red line represents the average M∕L in each 0.2 pc bin and the error bars are their standard deviations. The black line shows the number of filaments that intersect thecircumference of concentric circles drawn around the HFS as displayed in Fig. A.2.
Current usage metrics show cumulative count of Article Views (full-text article views including HTML views, PDF and ePub downloads, according to the available data) and Abstracts Views on Vision4Press platform.
Data correspond to usage on the plateform after 2015. The current usage metrics is available 48-96 hours after online publication and is updated daily on week days.
Initial download of the metrics may take a while.