Fig. 3
Download original image
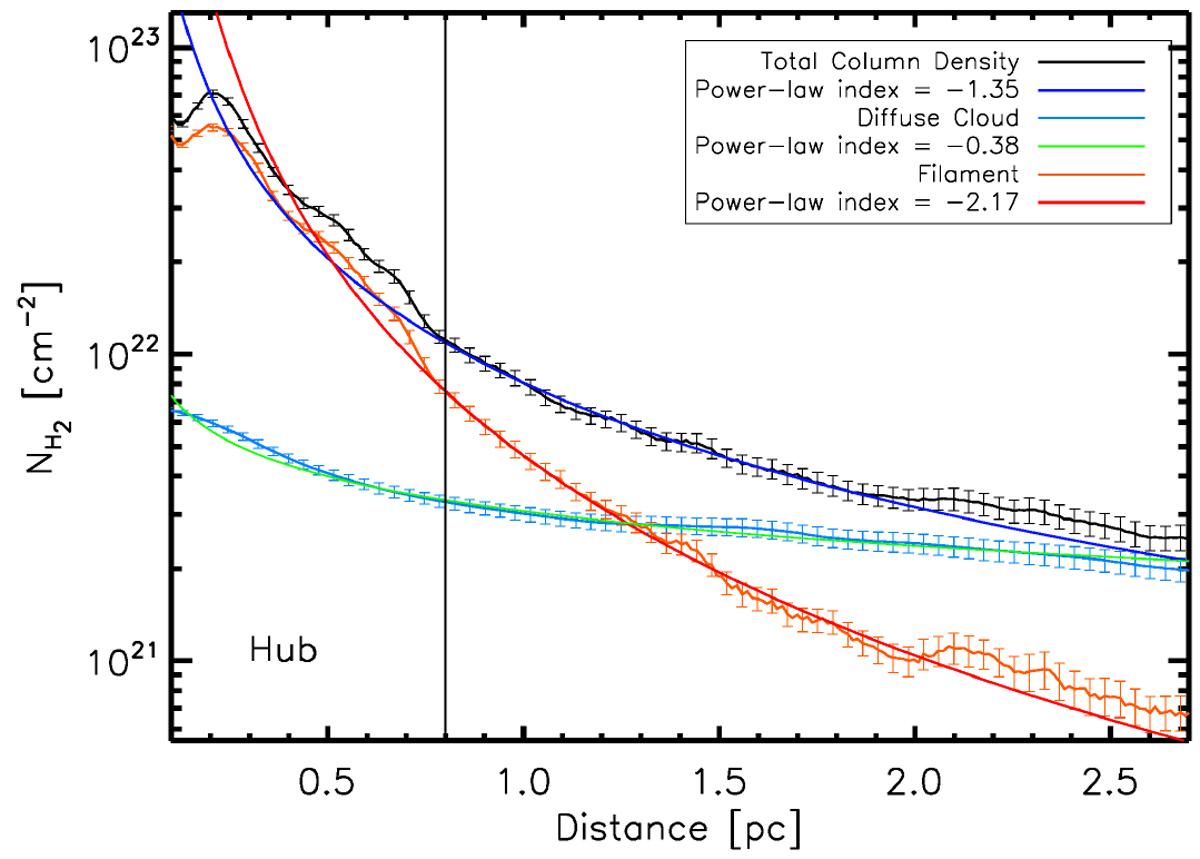
Radial profiles of the azimuthally averaged column density centred on the Mon R2 hub, as distributed in its structural components. The column density radial profile of the total map is compared with separated filaments and diffuse cloudcomponent maps. The fitted curves and their power-law indices are listed for each component. The fits ware performed for regions beyond 1 pc, excluding the hub. Error bars represent the standard deviation of the non-zero values in each pixel annulus.
Current usage metrics show cumulative count of Article Views (full-text article views including HTML views, PDF and ePub downloads, according to the available data) and Abstracts Views on Vision4Press platform.
Data correspond to usage on the plateform after 2015. The current usage metrics is available 48-96 hours after online publication and is updated daily on week days.
Initial download of the metrics may take a while.