Fig. 2
Download original image
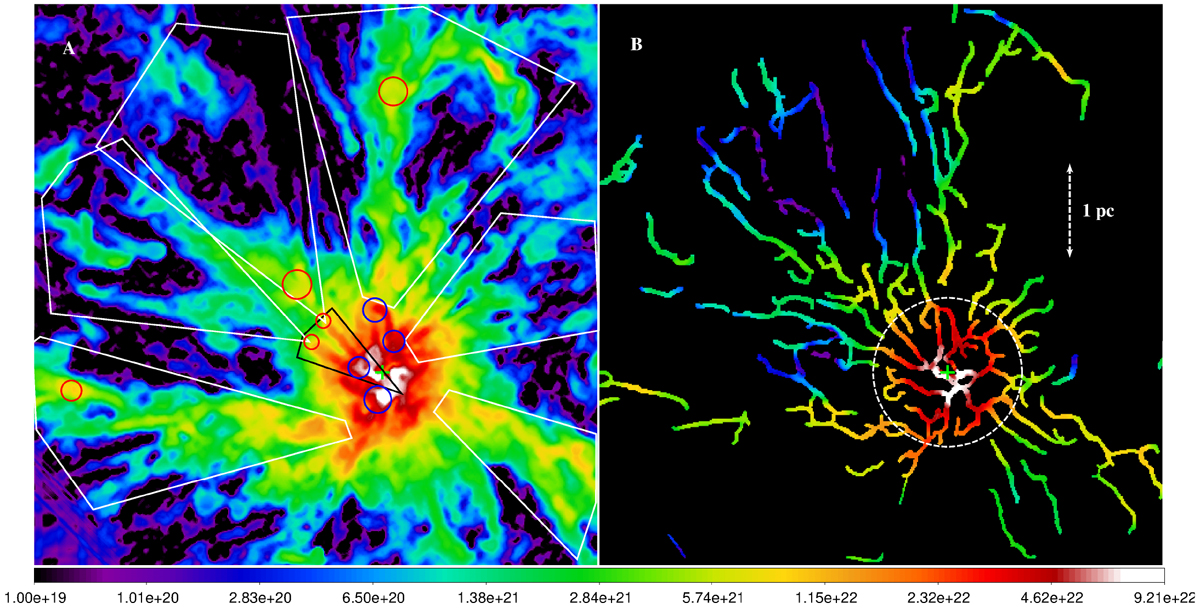
Coalescence of filaments: (a) colour map showing the column density of the filament component that is the sum of filaments detected over scales from 16′′ up to 258′′. Groups of coalescing filaments (see Sect. 4.1) are enclosed by white line boundaries. The black cone encloses an example of a second step in the coalescence. The red and blue circles (colours used for convenient visual contrast) identify some of the clear junctions of filaments within the coalescing groups where the density is visibly enhanced compared to the incoming structures. (b) Individual filament crests identified by getsf are used to mask the image in panel a. In both panels, the cross symbol at the centre (black and green in the left and right panels, respectively) indicates the position of the hub centre and radial origin.
Current usage metrics show cumulative count of Article Views (full-text article views including HTML views, PDF and ePub downloads, according to the available data) and Abstracts Views on Vision4Press platform.
Data correspond to usage on the plateform after 2015. The current usage metrics is available 48-96 hours after online publication and is updated daily on week days.
Initial download of the metrics may take a while.