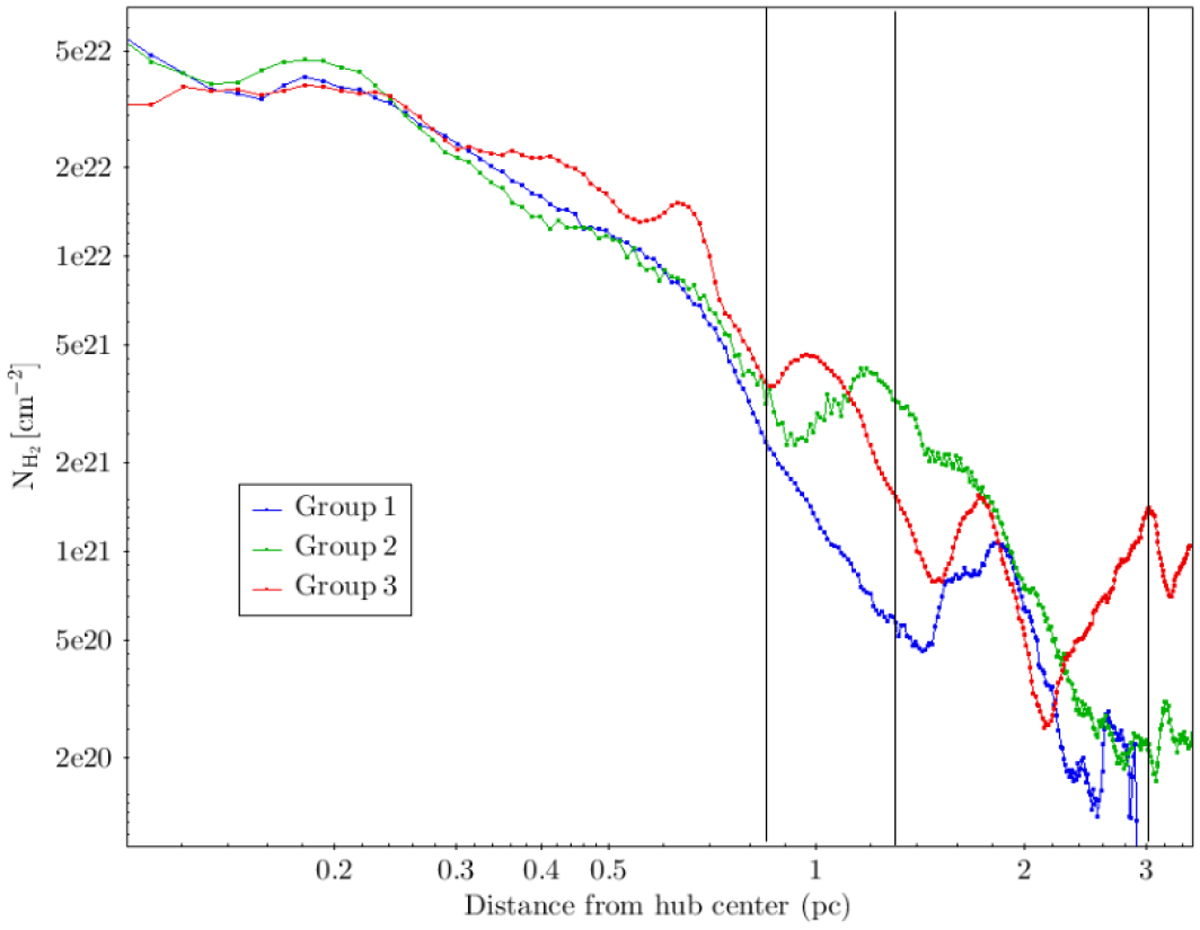
Fig. A.3
Download original image
Radial profiles of azimuthally averaged column density for the three groups of coalescing filaments identified in Fig. A.2. We note that these are profiles obtained on the filament-component map masked by detected skeletons. These groups encompass a larger number of filaments at larger distances while narrowing down on individual filaments closer to the centre. Readers should notice that the slopes of the radial profiles changes once at ~0.8 pc and again at ~0.2 pc. At larger distances from the centre, it is not possible to discern noticeable effects. The vertical lines at 3 pc, 1.3 pc, and 0.85 pc correspond to the two outermost red circles (nodes), the red circle just above the black cone, and the outer boundary of the black cone in Fig. 2a, respectively. They demarcate the two steps of coalescence suggested in Sec. 4.1
Current usage metrics show cumulative count of Article Views (full-text article views including HTML views, PDF and ePub downloads, according to the available data) and Abstracts Views on Vision4Press platform.
Data correspond to usage on the plateform after 2015. The current usage metrics is available 48-96 hours after online publication and is updated daily on week days.
Initial download of the metrics may take a while.