Open Access
Fig. A.2
Download original image
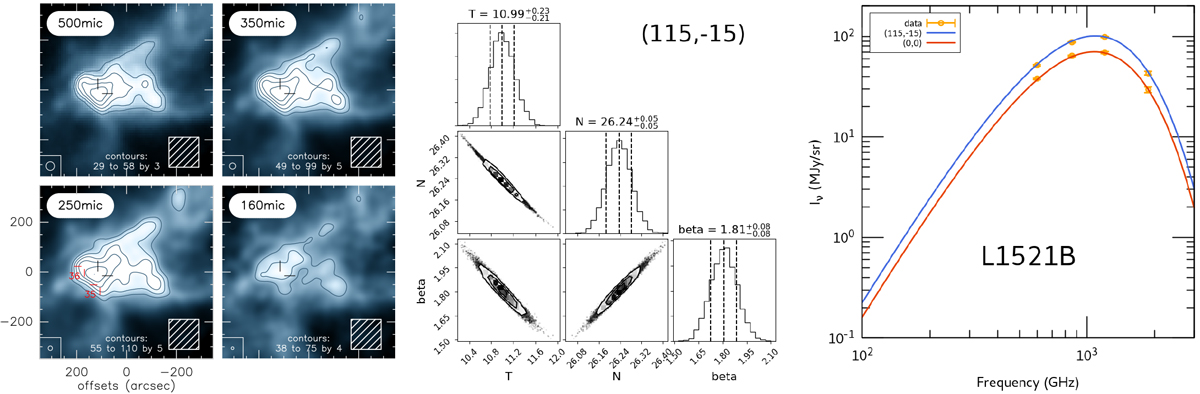
Determination of ![]() in L1521B (see Fig. A.1). The ammonia cores (35 and 36) mapped by Seo et al 2015 are shown in the 250 μm map of the left panel.
in L1521B (see Fig. A.1). The ammonia cores (35 and 36) mapped by Seo et al 2015 are shown in the 250 μm map of the left panel.
Current usage metrics show cumulative count of Article Views (full-text article views including HTML views, PDF and ePub downloads, according to the available data) and Abstracts Views on Vision4Press platform.
Data correspond to usage on the plateform after 2015. The current usage metrics is available 48-96 hours after online publication and is updated daily on week days.
Initial download of the metrics may take a while.