Fig. A.1
Download original image
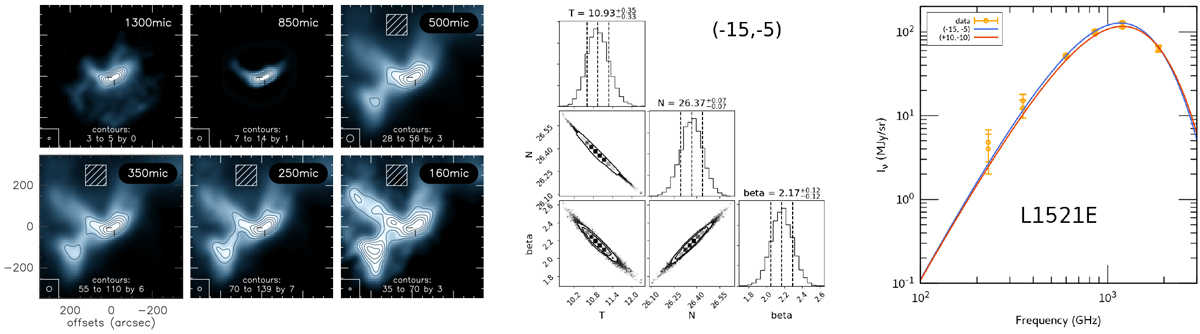
Determination of ![]() in L1521E through SED-fitting by a modified black-body spectrum. Left Dust emission, measured in L1521E with the IRAM-30m/MAMBO, Herschel/PACS, and SPIRE facilities, used to compute the
H2 column density (see Section A). The white cross-hairs locate the dust emission peak, at offsets
(−15”, −5”). The contours levels (start, end, increment, in MJy sr−1) are indicated in each panel. The hatched area indicates the region used to compute the background level and rms. Middle
Results toward offsets (−15”, −5”). Shown is a so-called "corner plot" showing the distribution of each free parameter (T,
in L1521E through SED-fitting by a modified black-body spectrum. Left Dust emission, measured in L1521E with the IRAM-30m/MAMBO, Herschel/PACS, and SPIRE facilities, used to compute the
H2 column density (see Section A). The white cross-hairs locate the dust emission peak, at offsets
(−15”, −5”). The contours levels (start, end, increment, in MJy sr−1) are indicated in each panel. The hatched area indicates the region used to compute the background level and rms. Middle
Results toward offsets (−15”, −5”). Shown is a so-called "corner plot" showing the distribution of each free parameter (T,
![]() , and spectral index β) in the diagonal panels, and the correlation between any pair of them (off-diagonal panels). The most likely parameters based on the χ2
likelihood are shown by the central dashed, vertical line, in each diagonal panel (the other vertical lines show the 10% and 86% quantiles). Right: Observed intensities and fitted SED (see Table A.1).
, and spectral index β) in the diagonal panels, and the correlation between any pair of them (off-diagonal panels). The most likely parameters based on the χ2
likelihood are shown by the central dashed, vertical line, in each diagonal panel (the other vertical lines show the 10% and 86% quantiles). Right: Observed intensities and fitted SED (see Table A.1).
Current usage metrics show cumulative count of Article Views (full-text article views including HTML views, PDF and ePub downloads, according to the available data) and Abstracts Views on Vision4Press platform.
Data correspond to usage on the plateform after 2015. The current usage metrics is available 48-96 hours after online publication and is updated daily on week days.
Initial download of the metrics may take a while.