Fig. 4
Download original image
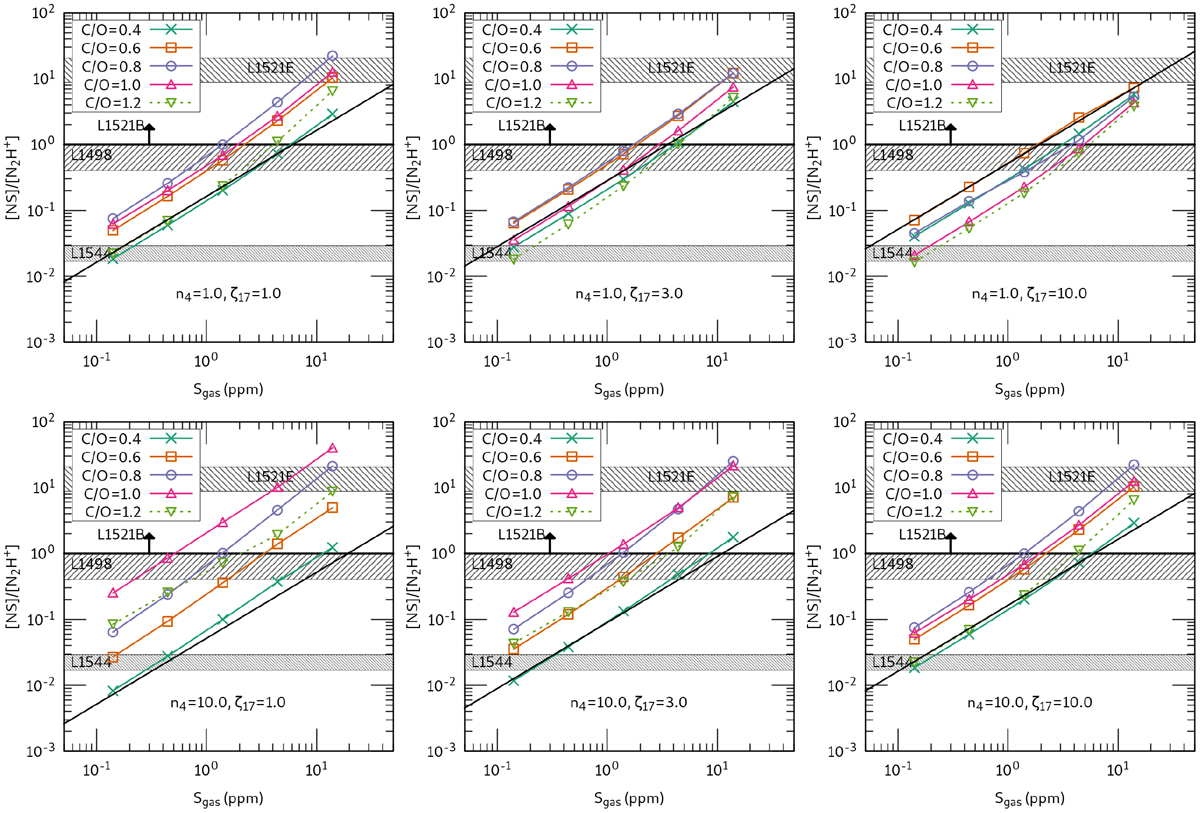
[NS]:[N2H+] ratio as a function of Sgas at steady-state from chemical models with with n4 = 1 (top) and 10 (bottom) and ζ17 = 1, 3, and 10 (left to right). In each panel, five values of the C/O ratio (0.4–1.2) are shown. The observed NS:N2H+ column density ratios (with ± 1σ uncertainties) toward L1521E, L1498, and L1544 (central position), are shown as hashed areas, and the lower limit in L1521B is indicated with an arrow. The black, straight, line shows our analytical prediction given in Eq. (13).
Current usage metrics show cumulative count of Article Views (full-text article views including HTML views, PDF and ePub downloads, according to the available data) and Abstracts Views on Vision4Press platform.
Data correspond to usage on the plateform after 2015. The current usage metrics is available 48-96 hours after online publication and is updated daily on week days.
Initial download of the metrics may take a while.