Fig. 3
Download original image
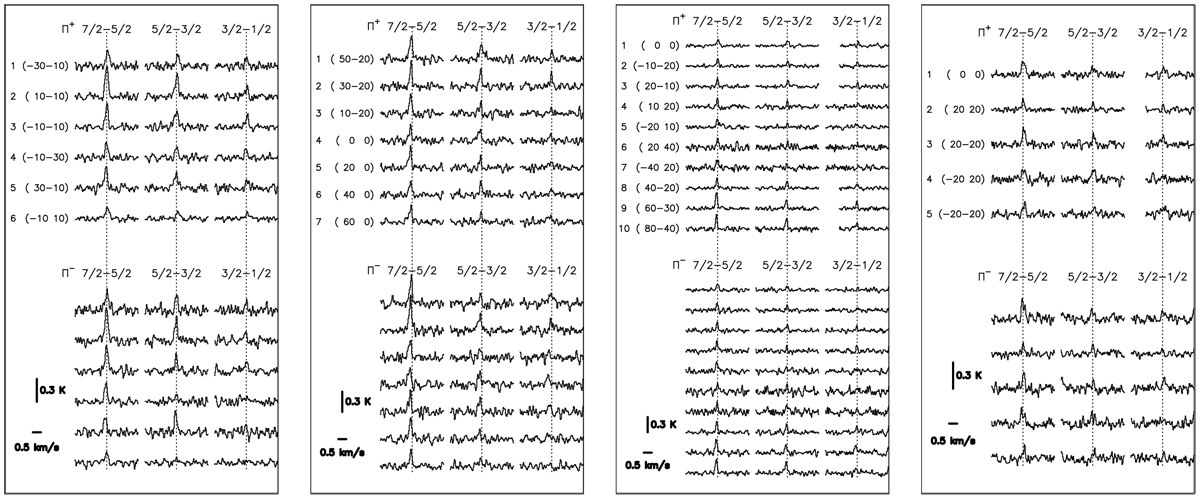
NS(J = 5∕2–3/2) spectra, in the ![]() temperature scale (in K), toward L1521E, L1521B, L1498, and L1544 (from left to right). In each panel, the hf set of lines (identified by their quantum number F) is split into the Π+ (top) and Π− (bottom) (see Table C.1). For the sake of clarity, hf transitions are shown individually. The position number (see
Fig. 2) and the offsets (in arcsec), with respect to the reference position given in Table 1, are indicated on the left of each spectrum. The vertical dotted lines indicate the adopted systemic velocity. The horizontal and vertical scales are indicated in bold face.
temperature scale (in K), toward L1521E, L1521B, L1498, and L1544 (from left to right). In each panel, the hf set of lines (identified by their quantum number F) is split into the Π+ (top) and Π− (bottom) (see Table C.1). For the sake of clarity, hf transitions are shown individually. The position number (see
Fig. 2) and the offsets (in arcsec), with respect to the reference position given in Table 1, are indicated on the left of each spectrum. The vertical dotted lines indicate the adopted systemic velocity. The horizontal and vertical scales are indicated in bold face.
Current usage metrics show cumulative count of Article Views (full-text article views including HTML views, PDF and ePub downloads, according to the available data) and Abstracts Views on Vision4Press platform.
Data correspond to usage on the plateform after 2015. The current usage metrics is available 48-96 hours after online publication and is updated daily on week days.
Initial download of the metrics may take a while.