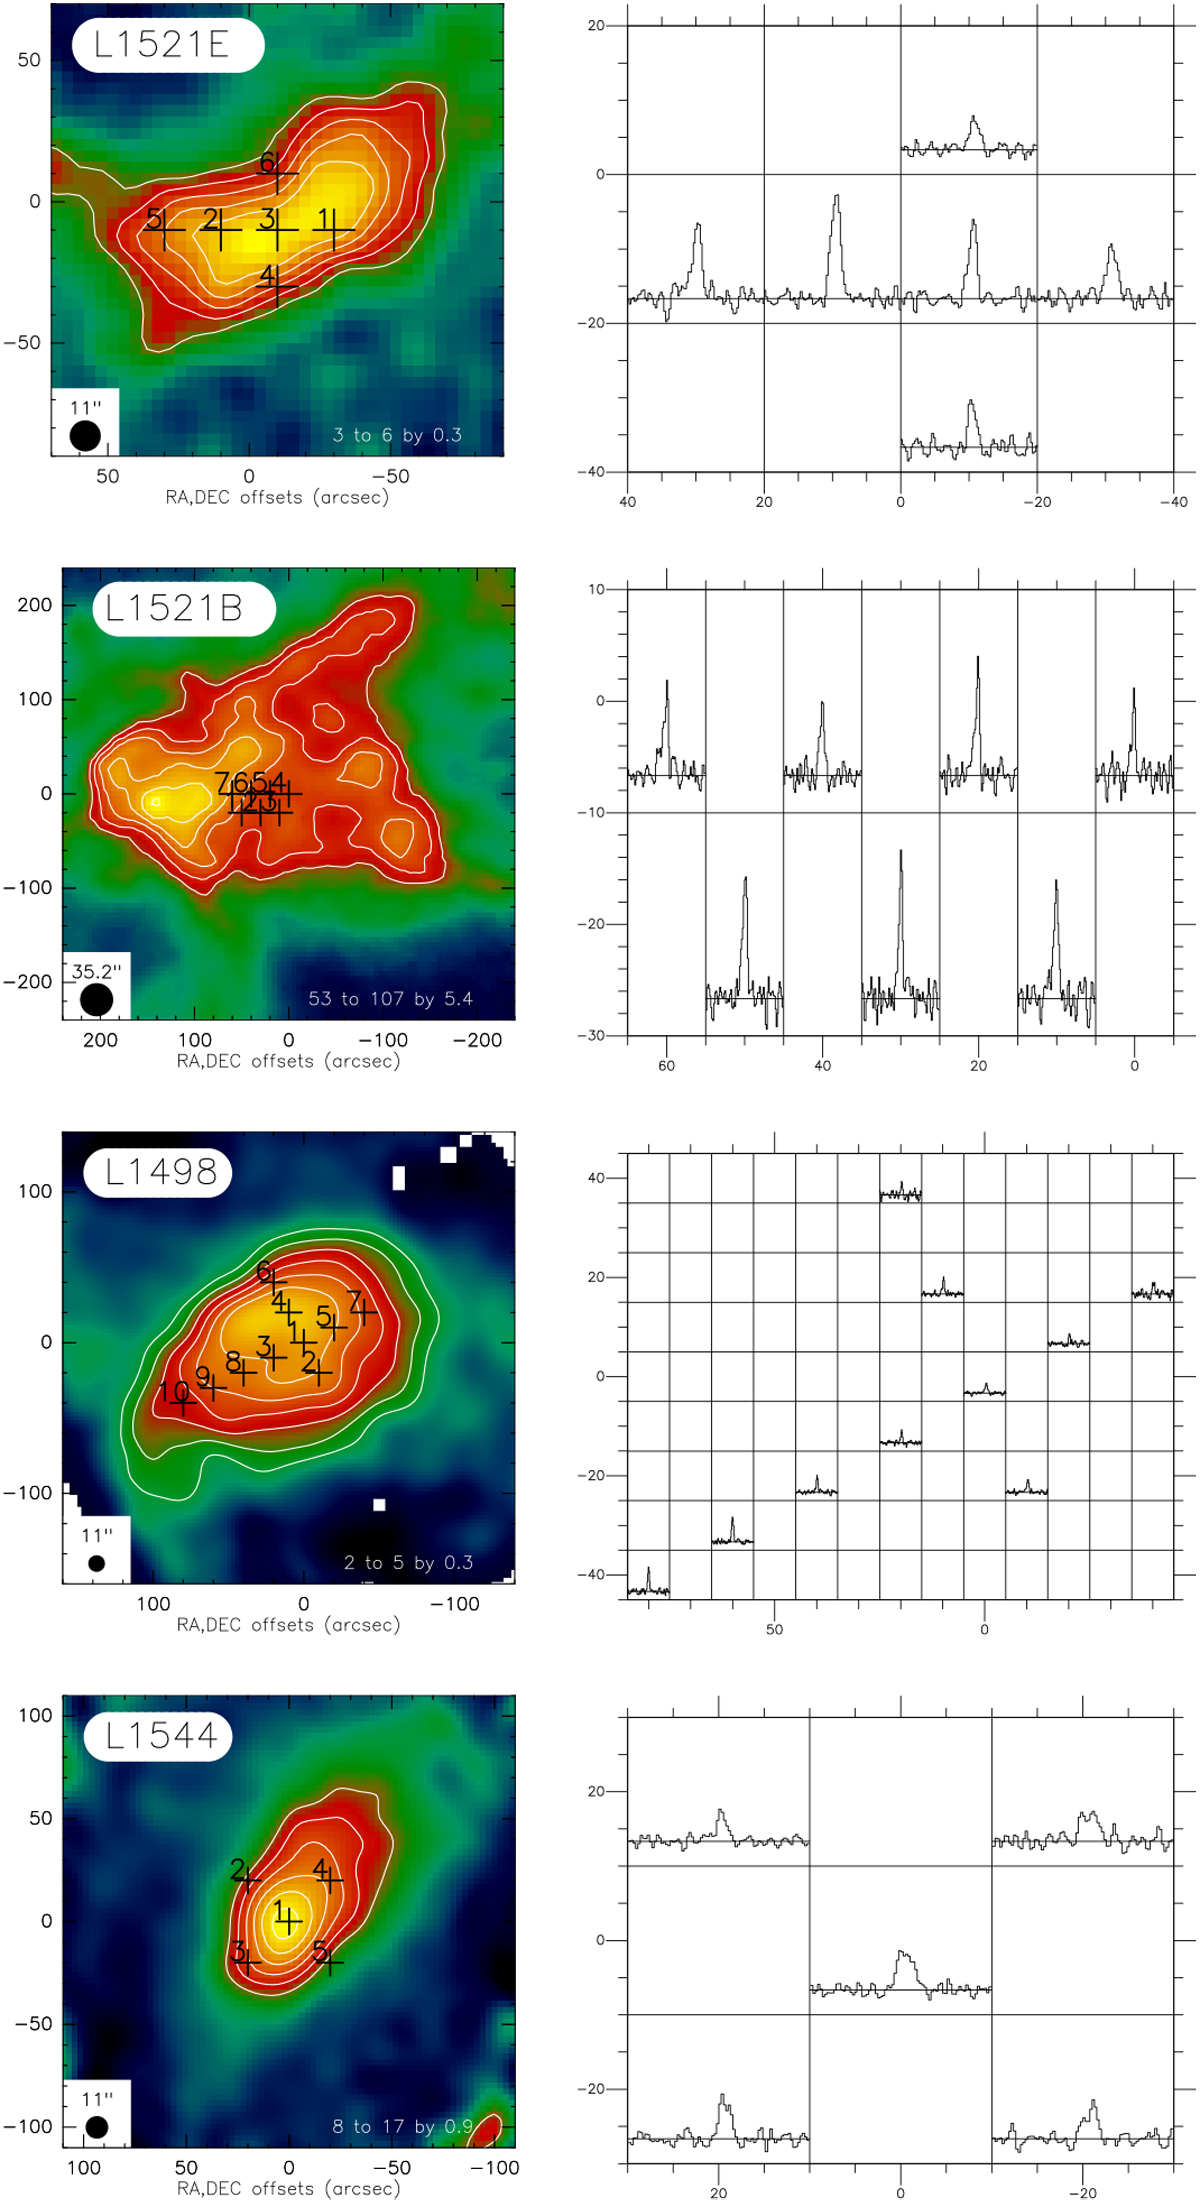
Fig. 2
Download original image
Maps of the dust emission and positions of the NS spectra for each source in the sample. Left: dust emission maps at λ = 1.3 mm (IRAM/30 m) toward L1521E, L1498, and L1544 (Tafalla et al. 2002, 2004), and at λ = 0.5 mm (Herschel/SPIRE) toward L1521B. Contour levels (in MJy sr−1) and HPBW are indicated in each panel. The reference positions (0′′, 0 offsets) are given in Table 1. Right: map of the NS emission line (only the main hyperfine component of the Π+ manifold at 115 GHz is shown; see also Fig. 3). The intensity scale (![]() , −0.1 to 0.5 K) is the same for all sources.
, −0.1 to 0.5 K) is the same for all sources.
Current usage metrics show cumulative count of Article Views (full-text article views including HTML views, PDF and ePub downloads, according to the available data) and Abstracts Views on Vision4Press platform.
Data correspond to usage on the plateform after 2015. The current usage metrics is available 48-96 hours after online publication and is updated daily on week days.
Initial download of the metrics may take a while.