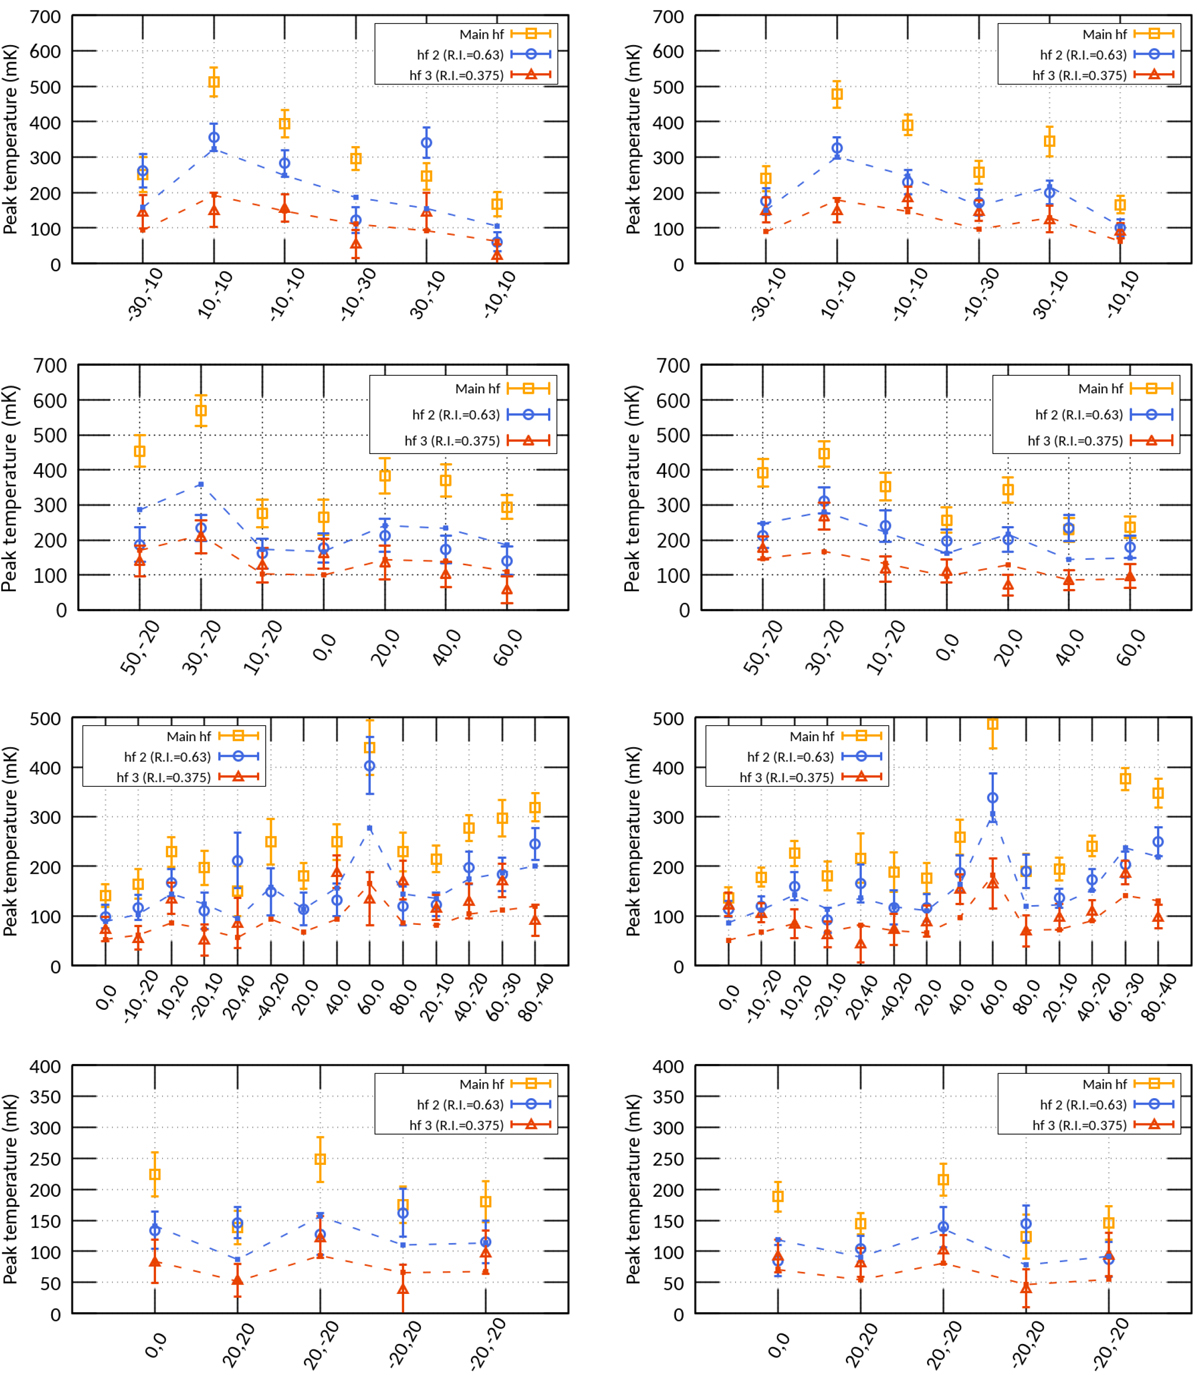
Fig. C.2
Download original image
Peak temperature (in mK) of the J = 5∕2 − 3∕2 Π− and Π+ manifolds (left and right columns resp.) toward L1521E, L1521B, L1498, and L1544 (from top to bottom) as obtained from Gaussian fits to the spectra. In each panel, the x-axis gives the position offsets (in ′′). Open symbols show the observations with 1σ error bars while the dashed lines and filled squares locate the theoretical peak intensity if optically thin lines and Boltzmann equilibrium assumptions hold.
Current usage metrics show cumulative count of Article Views (full-text article views including HTML views, PDF and ePub downloads, according to the available data) and Abstracts Views on Vision4Press platform.
Data correspond to usage on the plateform after 2015. The current usage metrics is available 48-96 hours after online publication and is updated daily on week days.
Initial download of the metrics may take a while.