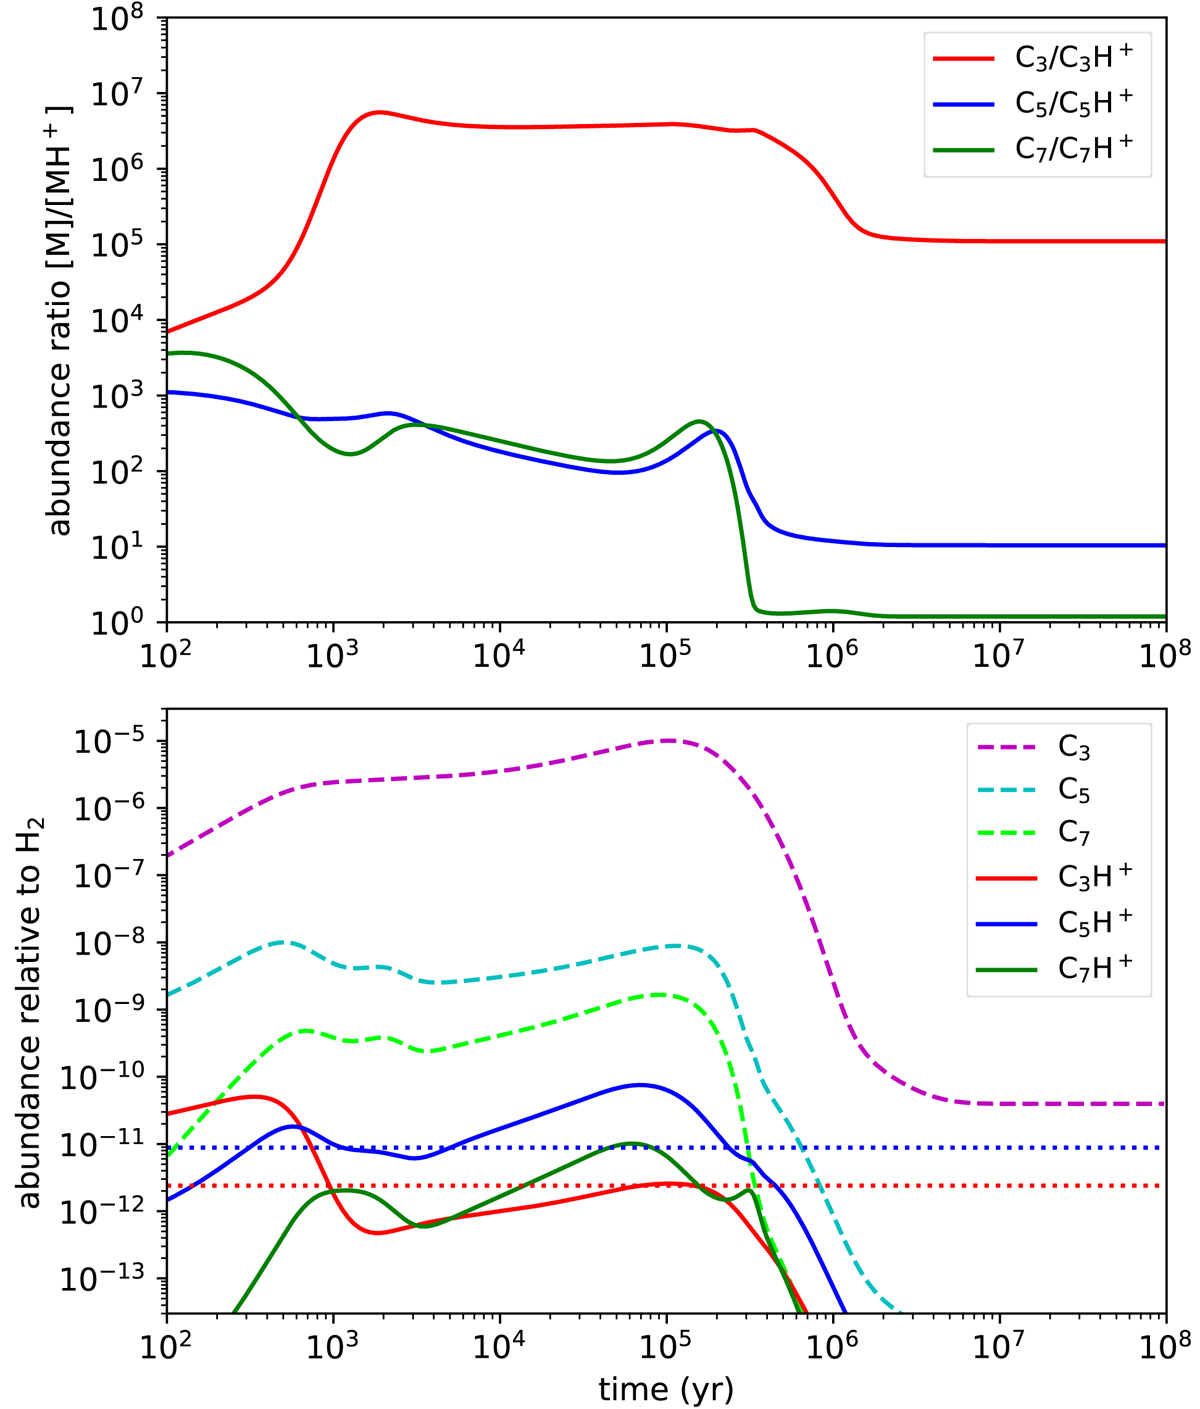
Fig. 3.
Download original image
Chemical models for the CnH+ species. Upper: computed abundance ratio between the clusters C3, C5 and C7 and their protonated forms CnH+ as a function of time. Lower: abundances relative to H2 for the carbon clusters and their protonated derivatives. The dotted horizontal lines correspond to the abundances observed in TMC-1 for C3H+ and C5H+.
Current usage metrics show cumulative count of Article Views (full-text article views including HTML views, PDF and ePub downloads, according to the available data) and Abstracts Views on Vision4Press platform.
Data correspond to usage on the plateform after 2015. The current usage metrics is available 48-96 hours after online publication and is updated daily on week days.
Initial download of the metrics may take a while.