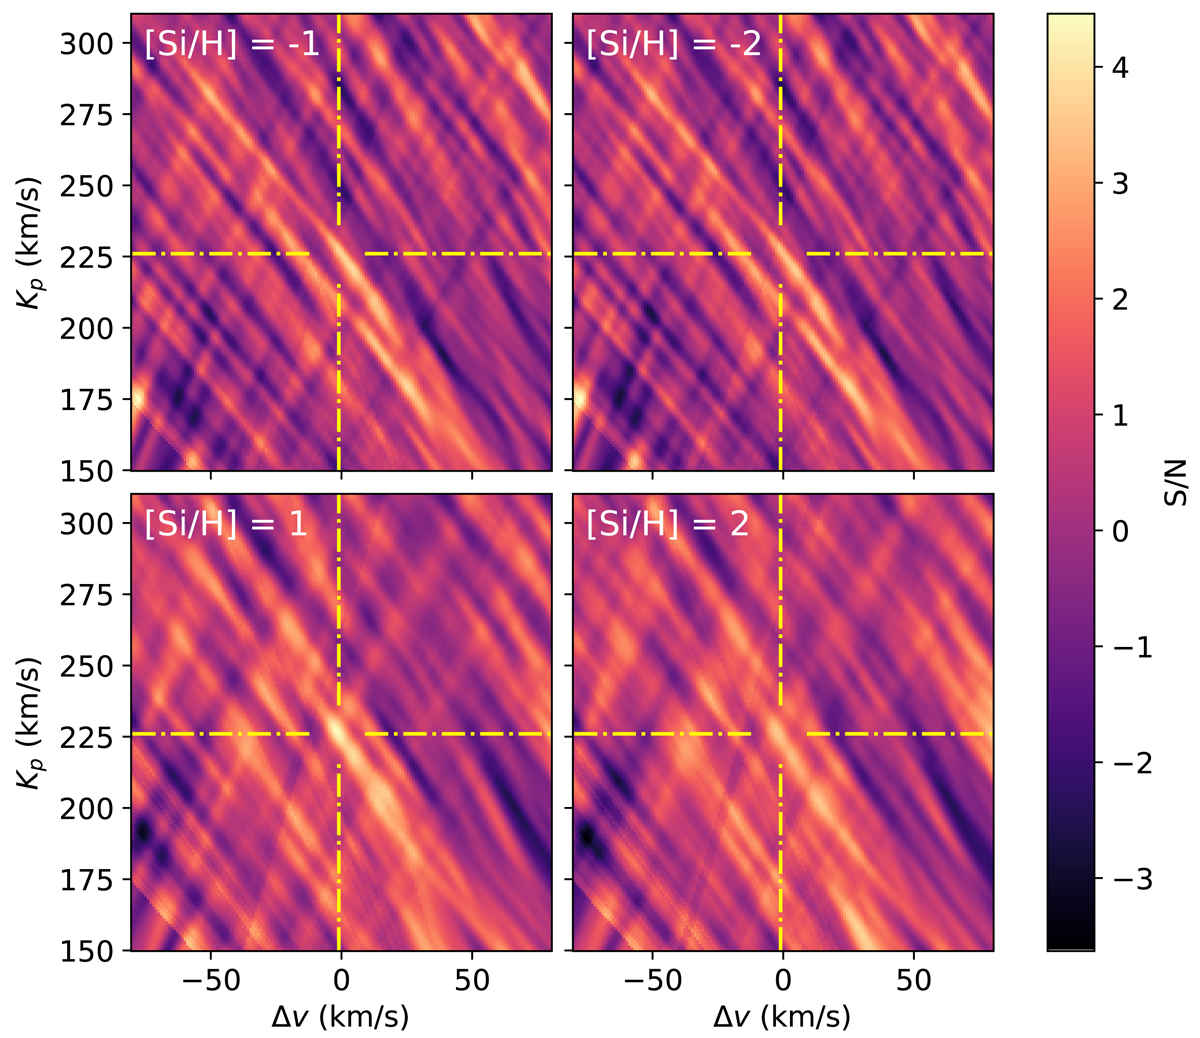
Fig. C.4.
Download original image
S/N maps of WASP-33b after three SYSREM iterations from model spectra with non-solar Si abundances. The top panels and bottom panels correspond to sub-solar and super-solar [Si/H] ratios, respectively. The yellow dashed-dotted lines indicate the location of the most significant detection peak, described in Sect. 4. The detection significance obtained with non-solar [Si/H] ratios is below the peak value obtained under the assumption of solar elemental abundances.
Current usage metrics show cumulative count of Article Views (full-text article views including HTML views, PDF and ePub downloads, according to the available data) and Abstracts Views on Vision4Press platform.
Data correspond to usage on the plateform after 2015. The current usage metrics is available 48-96 hours after online publication and is updated daily on week days.
Initial download of the metrics may take a while.