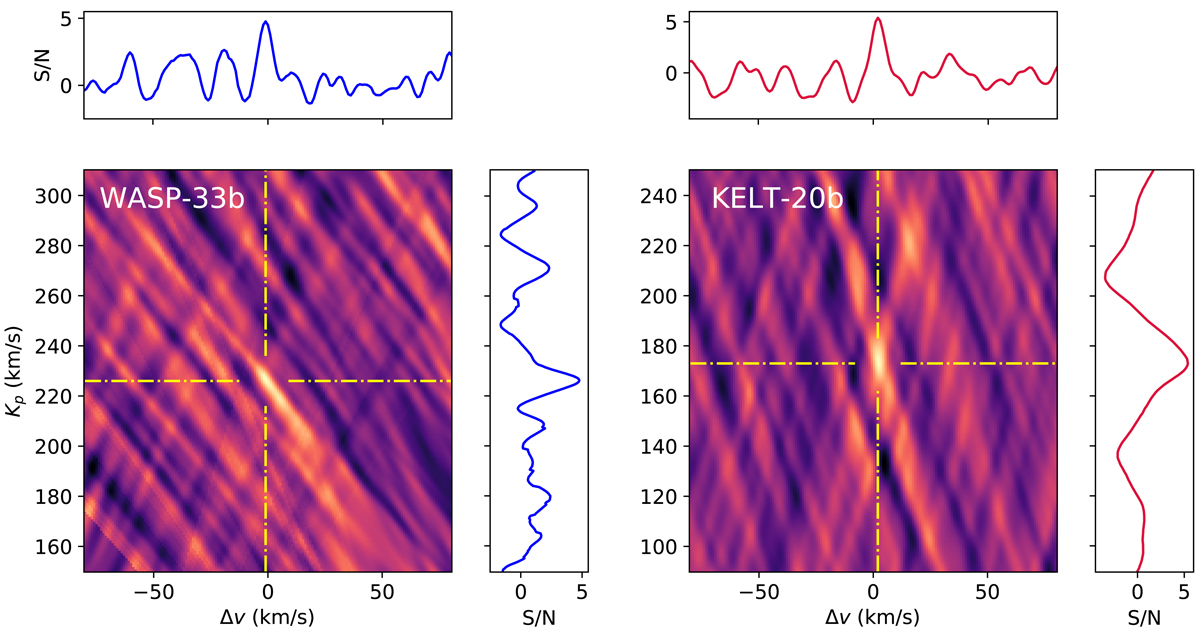
Fig. 3.
Download original image
S/N detection maps of neutral Si for WASP-33b (left panel) and KELT-20b (right panel). The signal of WASP-33b peaks with an S/N of 4.8 after three consecutive SYSREM iterations. For KELT-20b, we achieve the highest significance at S/N = 5.4 after four iterations. We indicate the peak coordinates by the yellow dashed-dotted lines. The horizontal and vertical panels correspond to the cross sections of the S/N peaks.
Current usage metrics show cumulative count of Article Views (full-text article views including HTML views, PDF and ePub downloads, according to the available data) and Abstracts Views on Vision4Press platform.
Data correspond to usage on the plateform after 2015. The current usage metrics is available 48-96 hours after online publication and is updated daily on week days.
Initial download of the metrics may take a while.