Fig. C.7.
Download original image
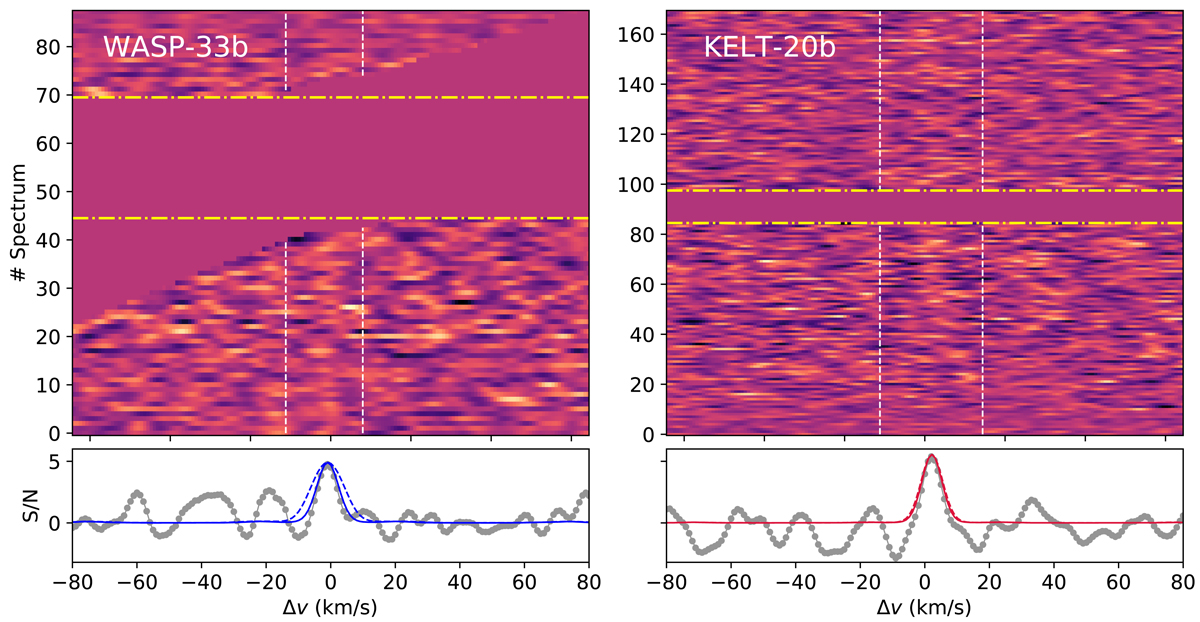
CCF maps of WASP-33b (left panels) and KELT-20b (right panels). The aligned CCF maps are shown in the top panels (assuming Kp values of 226.0 km s−1 and 173.0 km s−1 for WASP-33b and KELT-20b, respectively). The vertical dashed lines indicate the planetary trail; the horizontal dashed-dotted lines indicate ingress and egress from secondary eclipse. As described in Sect. 3.2, we masked the RV range of residual stellar Si lines in the CCF map of WASP-33b. In the bottom panels the collapsed CCF maps (gray lines) are compared to simulated CCFs (blue and red lines). The simulated CCFs that are rotationally broadened (by 7 km s−1 and 3 km s−1, respectively) are represented by the dashed lines. Those without broadening are represented by the solid lines. We note that in the case of KELT-20b, the simulated CCFs with and without broadening differ only marginally and therefore lie on top of each other.
Current usage metrics show cumulative count of Article Views (full-text article views including HTML views, PDF and ePub downloads, according to the available data) and Abstracts Views on Vision4Press platform.
Data correspond to usage on the plateform after 2015. The current usage metrics is available 48-96 hours after online publication and is updated daily on week days.
Initial download of the metrics may take a while.