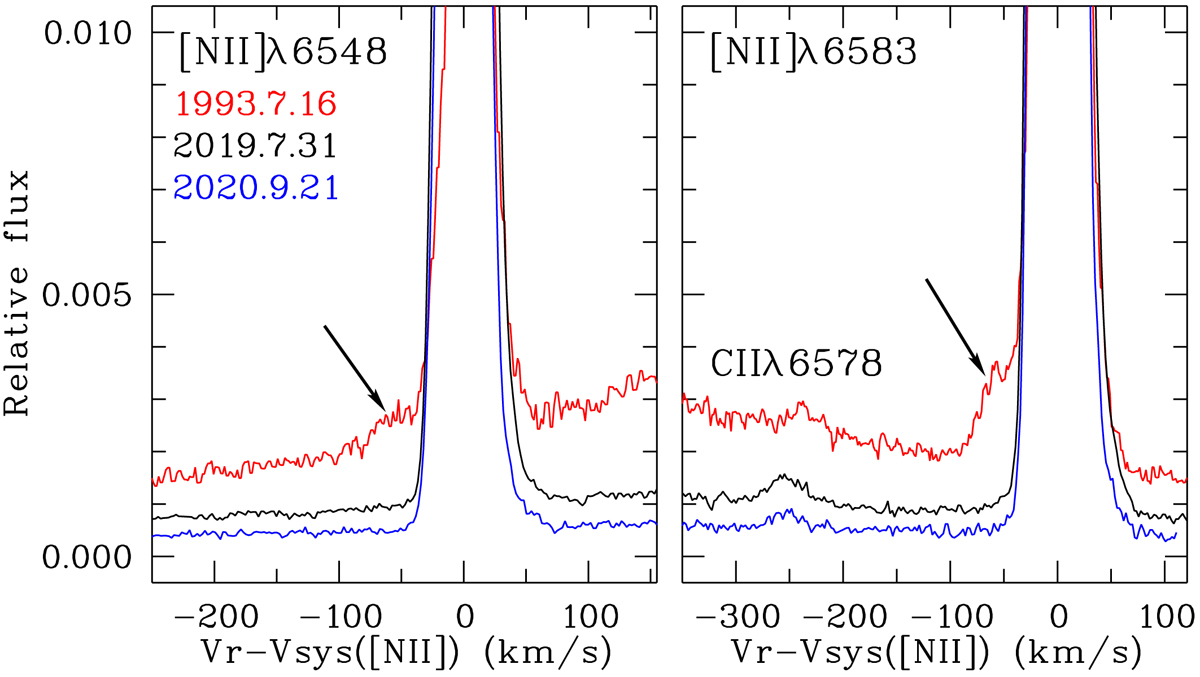
Fig. 3.
Download original image
Details of [N II]λλ6548,6583 emission line profiles in the three epochs around the HVC observed in 1993 (arrowed). The C II emission line seems to be redshifted in the 1993 spectrum as compared with the 2019 and 2020 ones. The very poor S/N in the 1993 spectrum of this line does not allow us to state whether this shift is real.
Current usage metrics show cumulative count of Article Views (full-text article views including HTML views, PDF and ePub downloads, according to the available data) and Abstracts Views on Vision4Press platform.
Data correspond to usage on the plateform after 2015. The current usage metrics is available 48-96 hours after online publication and is updated daily on week days.
Initial download of the metrics may take a while.