Free Access
Fig. 2.
Download original image
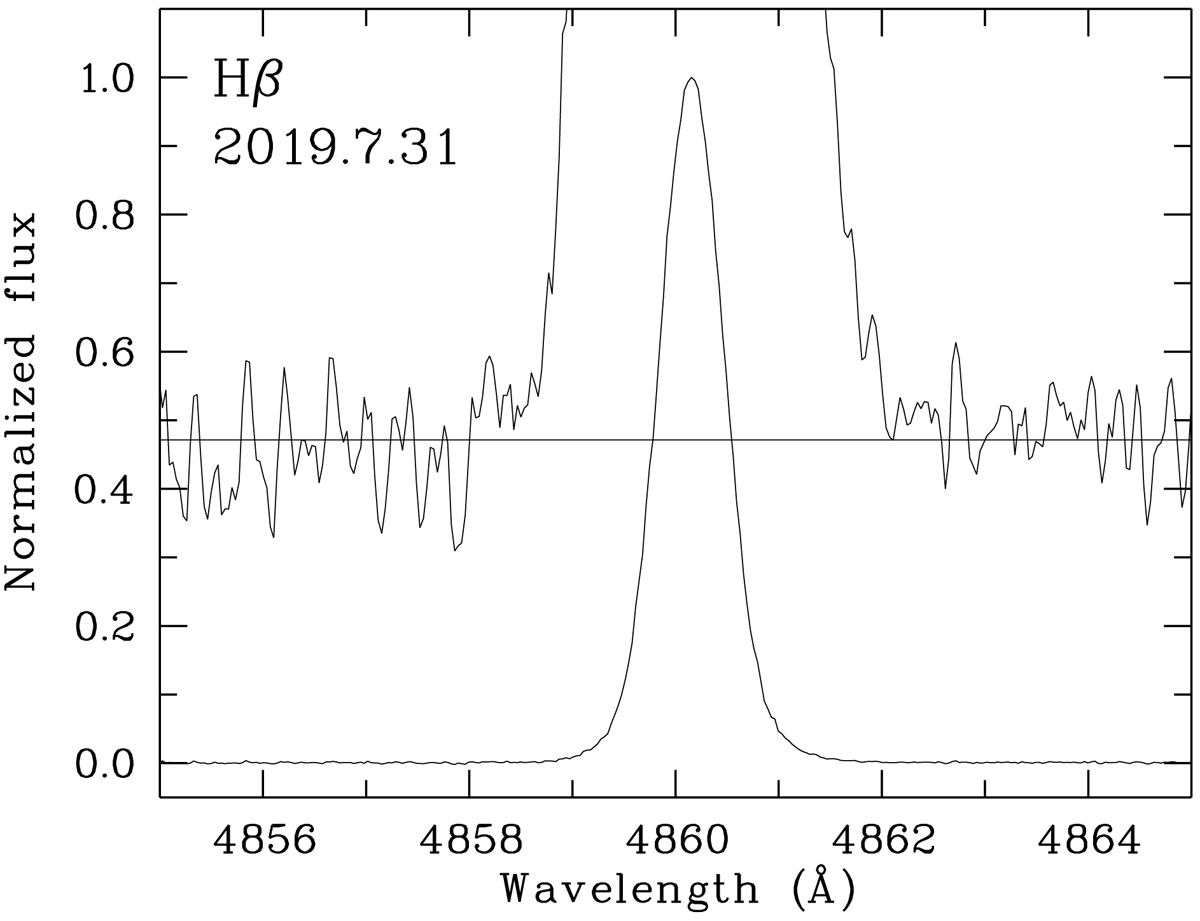
Normalized Hβ emission line profile as observed in 2019. The profile is presented at two scales to show the absence of broad wings in this line. The upper profile has been smoothed, and the horizontal line represents the continuum obtained from emission-line-free regions at both sides of the Hβ line.
Current usage metrics show cumulative count of Article Views (full-text article views including HTML views, PDF and ePub downloads, according to the available data) and Abstracts Views on Vision4Press platform.
Data correspond to usage on the plateform after 2015. The current usage metrics is available 48-96 hours after online publication and is updated daily on week days.
Initial download of the metrics may take a while.