Fig. 1.
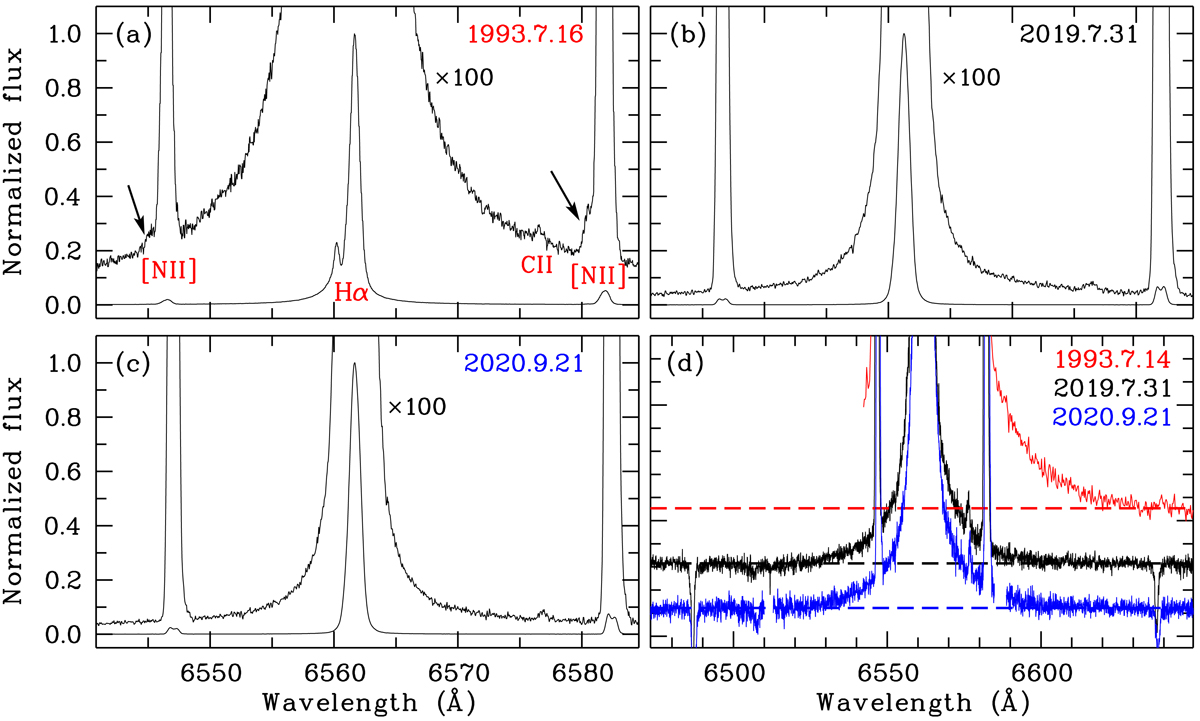
Download original image
Profiles of the Hα emission line. Panels a–c: high-resolution spectra of IC 4997 between 6450 and 6670 Å at the three epochs. The spectra are normalized to the intensity peak of the Hα emission line in each epoch and are shown at two different scales. Panel a marks the observed emission lines and the [N II] HVC detected in 1993 (see also Fig. 3). Panel d: spectra at the three epochs between 6473 and 6649.5 Å, arbitrarily shifted vertically. The 1993 spectrum is adapted from MTE96 and covers from 6542 Å. The horizontal line associated with each spectrum represents the stellar continuum extrapolated from line-free regions. The absorption at ∼6637.8 Å in the 2019 and 2020 spectra d does not correspond to the O Iλ1027 Å Raman feature identified in Orion (Henney 2021) and could be telluric.
Current usage metrics show cumulative count of Article Views (full-text article views including HTML views, PDF and ePub downloads, according to the available data) and Abstracts Views on Vision4Press platform.
Data correspond to usage on the plateform after 2015. The current usage metrics is available 48-96 hours after online publication and is updated daily on week days.
Initial download of the metrics may take a while.