Fig. 8
Download original image
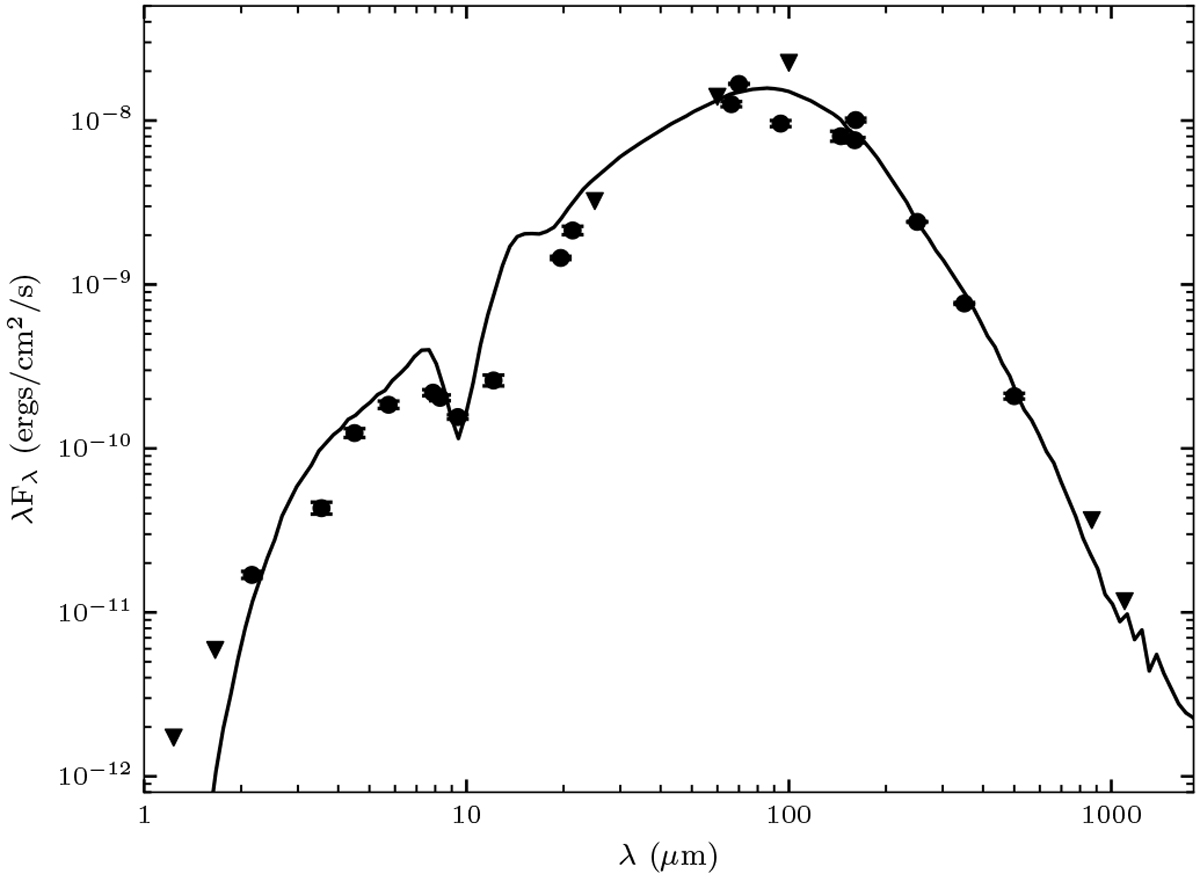
Observed and modelled SED of IRAS 17527-2439. The 2MASS fluxes at 1.25 μm (J band) and at1.66 μm (H band), the IRAS fluxes at 25, 60 and 100 μm, and the ATLASGAL flux at 870 μm and Bolocam flux at 1.1 mm are only upper limits. The continuous line shows the best-fit model obtained using the Robitaille et al. (2007) fitting tool. No other fit is adequate within the interval
![]() , where n is the number of data points used in the fitting. In addition, no other model could be found by increasing this range by a factor of 1000.
, where n is the number of data points used in the fitting. In addition, no other model could be found by increasing this range by a factor of 1000.
Current usage metrics show cumulative count of Article Views (full-text article views including HTML views, PDF and ePub downloads, according to the available data) and Abstracts Views on Vision4Press platform.
Data correspond to usage on the plateform after 2015. The current usage metrics is available 48-96 hours after online publication and is updated daily on week days.
Initial download of the metrics may take a while.