Fig. 6
Download original image
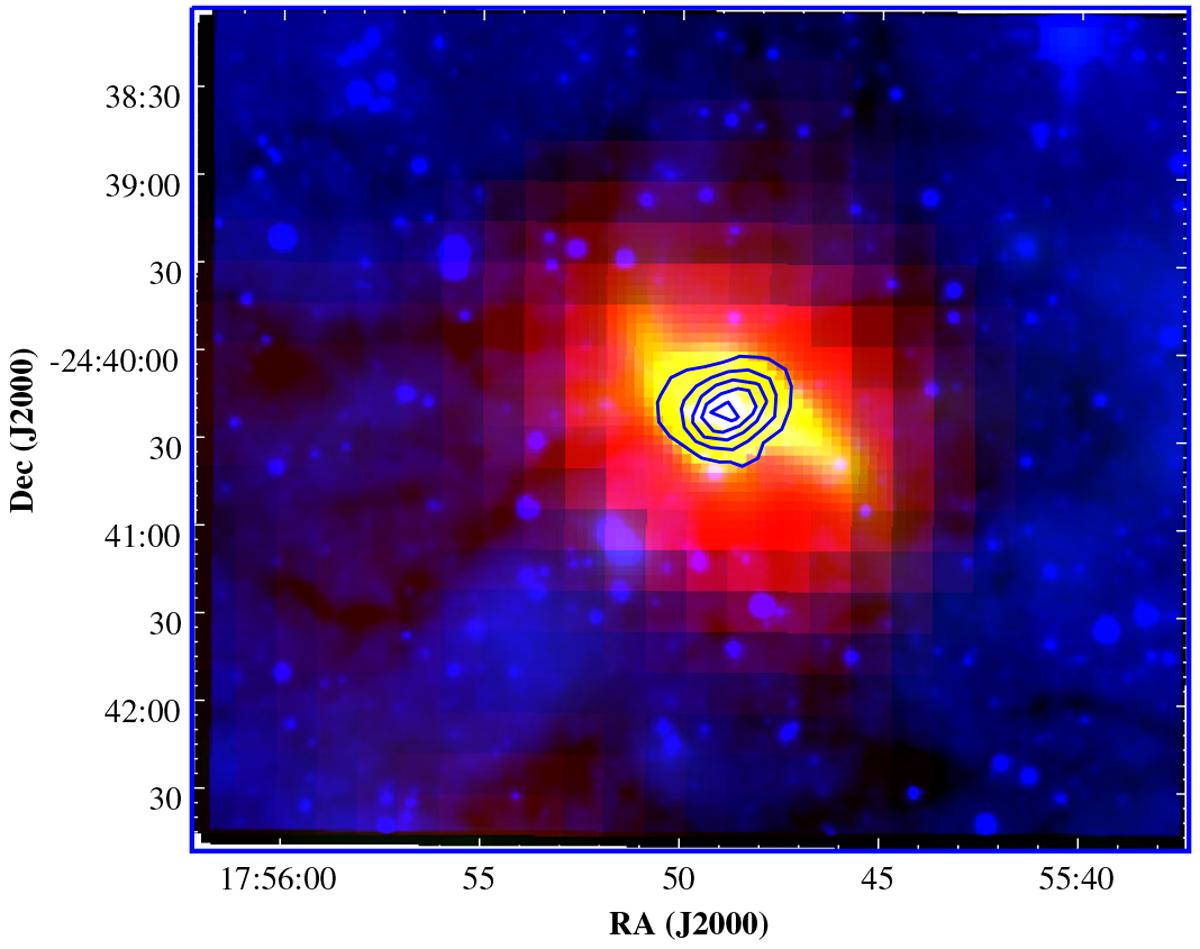
Composite image of a field of 10′ × 7′ centred on IRAS 17527-2439. The IRAC/Spitzer 8 μm band is in blue, Herschel-PACS 70 μm is in yellow, and SPIRE/Herschel 500 μm is in red. The blue contours are from the ATLASGAL 870 μm data, and correspond to levels of 0.6, 0.98, 1.35, 1.73, and 2.1 Jy beam−1. The patchyopaque silhouettes extending towards the border of the figure highlight the IRDC detected by Chen et al. (2013), associated with the EGO G4.83+0.23.
Current usage metrics show cumulative count of Article Views (full-text article views including HTML views, PDF and ePub downloads, according to the available data) and Abstracts Views on Vision4Press platform.
Data correspond to usage on the plateform after 2015. The current usage metrics is available 48-96 hours after online publication and is updated daily on week days.
Initial download of the metrics may take a while.