Fig. 4
Download original image
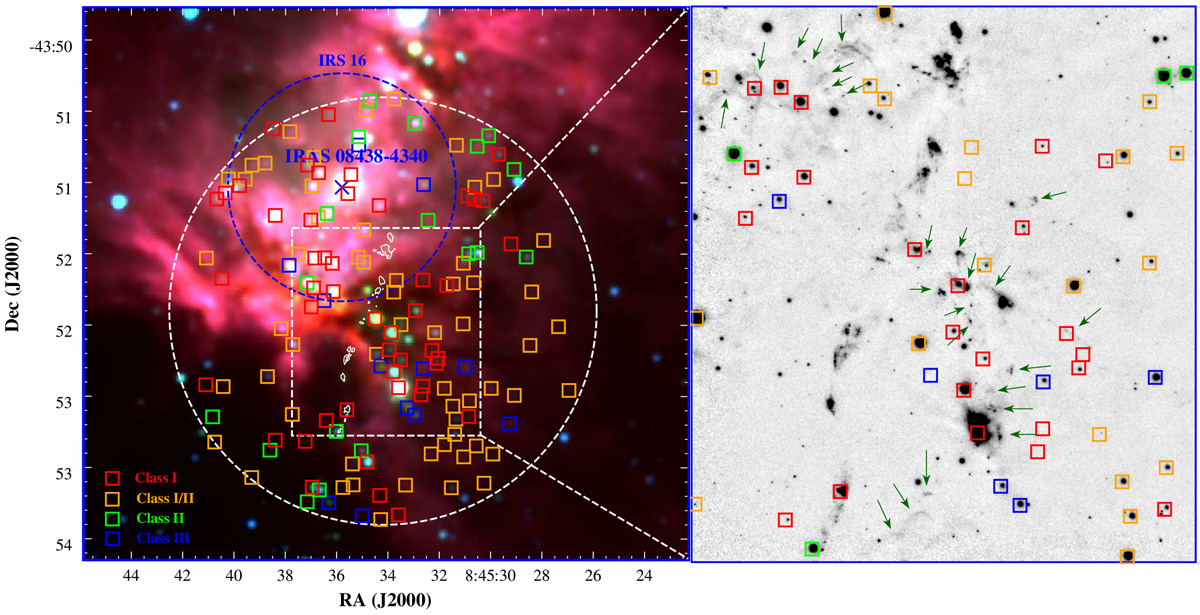
Left panel: three-colour image with 3.6 μm (blue), 4.5 μm (green) and 8.0 μm (red) of the H II region G263.619-0.53. The dashed blue circle indicates the area of the IRS 16 stellar cluster defined by Massi et al. (2003). The dashed white square highlights the area observed with GSAOI + GeMS, comprising the MHO 1502 jet. The dashed white circle is centred at (α,δ)(J2000) = (08:45:34.2; −43:51:54.1), has a radius of 1.5′, and defines our search area. The white contours mark the H2 knots of MHO 1502 and the blue cross indicates the location of IRAS 08438-4340, the central source associated with the HII region. The coloured squares show the YSOs detected in the [8.0] vs. [4.5]–[8.0] diagram and are classified according to the [3.6]–[4.5] vs. [5.8]–[8.0] diagram (see Fig. 3) as follows: Red squares are Class I, orange squares denote Class I/II, and green ones are Class II sources. Blue squares correspond to Class III as well as the foreground and background sources. Right panel: inverted grey-scale H2 image of the MHO 1502 jet obtained with GSAOI + GeMS. YSOs in the field are shown. The symbols used are the same as those in the left panel. The dark green arrows highlight the H2 emissions not associated with the MHO 1502 jet (see also Fig. 1).
Current usage metrics show cumulative count of Article Views (full-text article views including HTML views, PDF and ePub downloads, according to the available data) and Abstracts Views on Vision4Press platform.
Data correspond to usage on the plateform after 2015. The current usage metrics is available 48-96 hours after online publication and is updated daily on week days.
Initial download of the metrics may take a while.