Fig. 3
Download original image
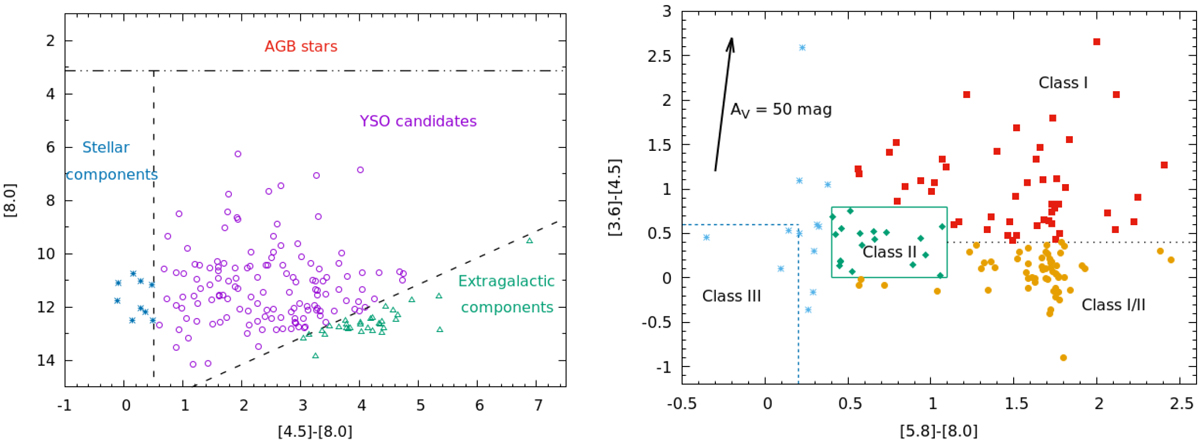
Left panel: [8.0] vs. [4.5]–[8.0] diagram of a subsample of the VMR-D IRAC point-source, catalogued in Table 5 of Strafella et al. (2010), within a radius of 1.5′ centred at the position of MHO 1502 (α,δ)(J2000) = (08:45:34.2; −43:51:54.1). The dashed lines mark the statistical criteria of Harvey et al. (2006, 2007) scaled to the distance of VMR-D (see text) in order to distinguish YSO candidates (magenta circles) from other types of contaminating sources, such as: extragalactic objects (green triangles), normal stars (blue asterisks), and AGB stars. Right panel: [3.6]–[4.5] vs. [5.8]–[8.0] diagram. The central squared green region indicates the domain of Class II YSO sources (green diamonds) according to statistical criteria derived by Allen et al. (2004) and Megeath et al. (2004). The dotted blue line encloses the location of sources without IR excess (Flaherty et al. 2007). The Class I (red squares), Class II (green diamonds), Class I/II (orange circles), and Class III/foreground/background sources (light blue asterisks) objects are marked. The reddening vector (black arrow) corresponds to AV = 50 mag (Strafella et al. 2010).
Current usage metrics show cumulative count of Article Views (full-text article views including HTML views, PDF and ePub downloads, according to the available data) and Abstracts Views on Vision4Press platform.
Data correspond to usage on the plateform after 2015. The current usage metrics is available 48-96 hours after online publication and is updated daily on week days.
Initial download of the metrics may take a while.