Fig. 2
Download original image
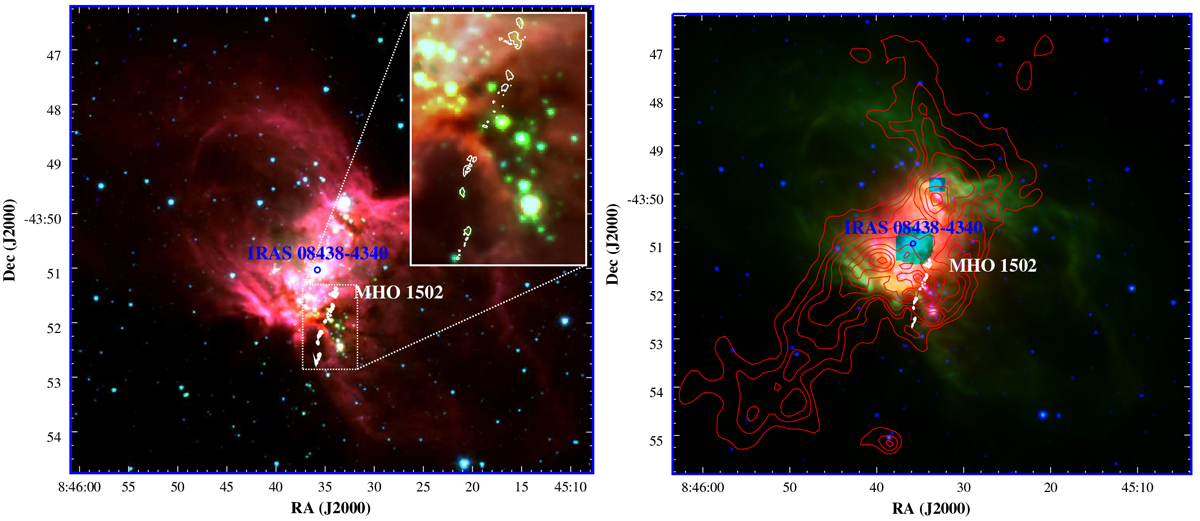
Composite images of the H II region G263.619-0.53. Left panel: three–colour image combining IRAC/Spitzer 3.6 μm (blue), 4.5 μm (green) and 8.0 μm (red) images. The inserted enlarged rectangle in the upper-right corner shows in white contours the location of the H2 knots associated with the MHO 1502 jet. Right panel: combined IRAC-MIPS/Spitzer 4.5 μm (in blue), 8 μm (in green) and 24 μm (in red) images. The superimposed continuous red lines are the column density contours taken from Marsh et al. (2017). Column density levels are 5, 6, 7, 9, 15, 25, 35, 45 and 56 × 1021 cm−2. The white contours indicate the location of the MHO 1502 jet. In both planes, the blue circle marks the position of the IRAS 08438-4340 exciting source.
Current usage metrics show cumulative count of Article Views (full-text article views including HTML views, PDF and ePub downloads, according to the available data) and Abstracts Views on Vision4Press platform.
Data correspond to usage on the plateform after 2015. The current usage metrics is available 48-96 hours after online publication and is updated daily on week days.
Initial download of the metrics may take a while.