Fig. 10
Download original image
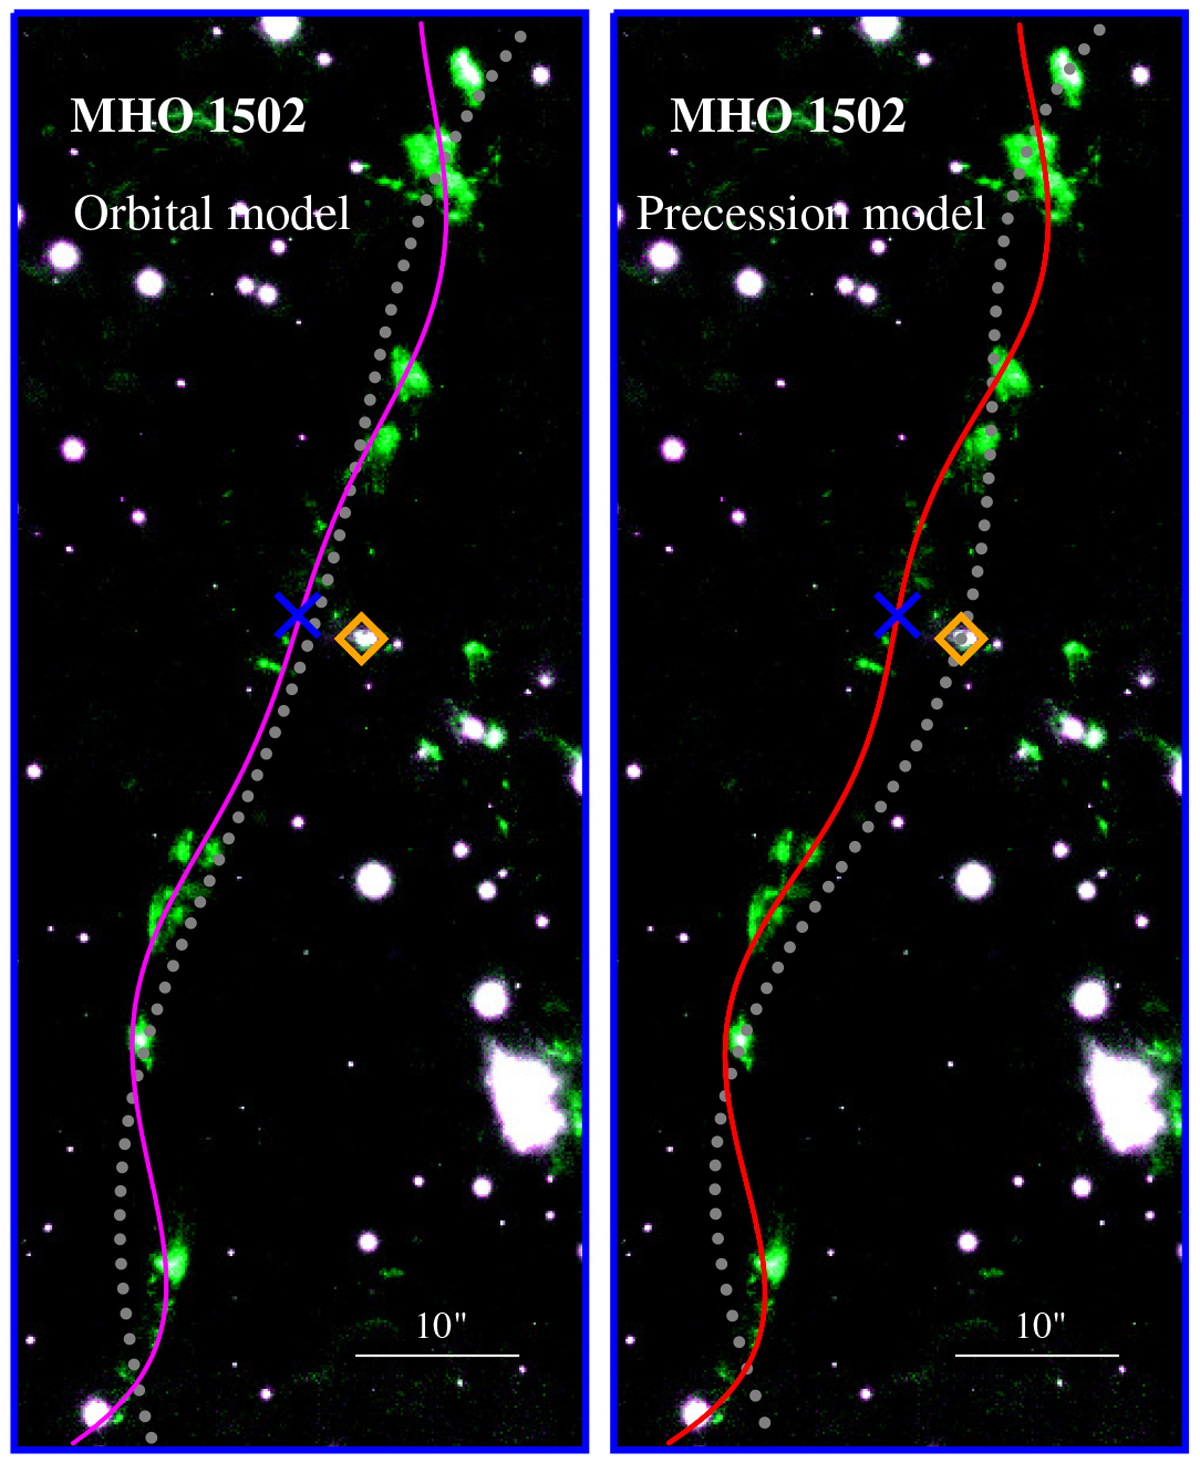
Orbital (left panel) and precession (right panel) models for MHO 1502 superposed on the combined H2 (green) and K (magenta) band image. The blue cross at (α, δ)(J2000) = (08:45:34.9; −43:51:55.9) indicates the centre along the jet axis that provides the best fits, and the orange diamond marks the position of IRAC 18064 identified by Strafella et al. (2010). The magenta and red lines show the models centred on the blue cross. The dotted grey lines are the models centred on the IRAC 18064 source.
Current usage metrics show cumulative count of Article Views (full-text article views including HTML views, PDF and ePub downloads, according to the available data) and Abstracts Views on Vision4Press platform.
Data correspond to usage on the plateform after 2015. The current usage metrics is available 48-96 hours after online publication and is updated daily on week days.
Initial download of the metrics may take a while.