Fig. 1
Download original image
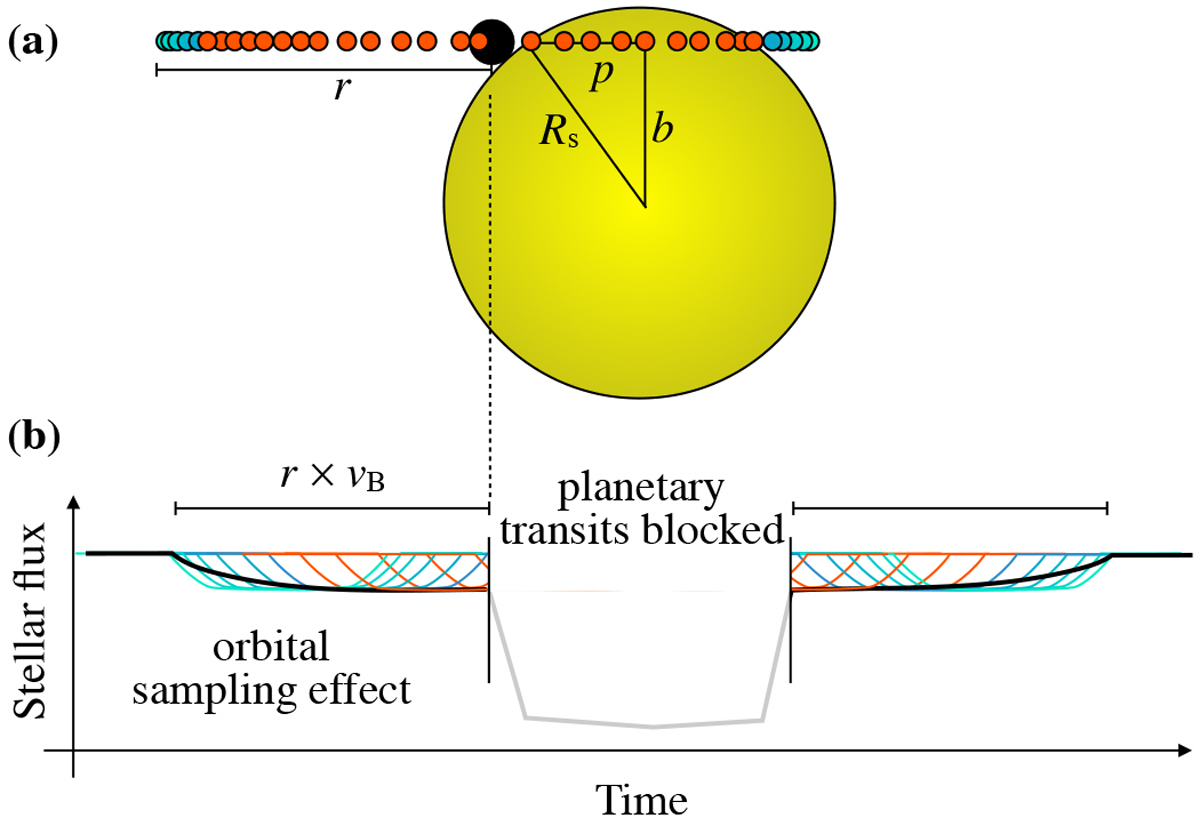
(a) Transit geometry of the three-body system consisting of a star (large yellow circle), a planet (black circle), and a moon (orange and blue circles). The transit path across the star equals
![]() . (b) Illustration of an exomoon’s orbital sampling effect (OSE; Heller 2014; Heller et al. 2016a) in the light curve. The circumstellar orbital velocity of the barycenter (vB) multiplied by the planet-moon orbital separation (r) defines the duration of the OSE feature before and after the planetary transit.
. (b) Illustration of an exomoon’s orbital sampling effect (OSE; Heller 2014; Heller et al. 2016a) in the light curve. The circumstellar orbital velocity of the barycenter (vB) multiplied by the planet-moon orbital separation (r) defines the duration of the OSE feature before and after the planetary transit.
Current usage metrics show cumulative count of Article Views (full-text article views including HTML views, PDF and ePub downloads, according to the available data) and Abstracts Views on Vision4Press platform.
Data correspond to usage on the plateform after 2015. The current usage metrics is available 48-96 hours after online publication and is updated daily on week days.
Initial download of the metrics may take a while.