Free Access
Fig. 6.
Download original image
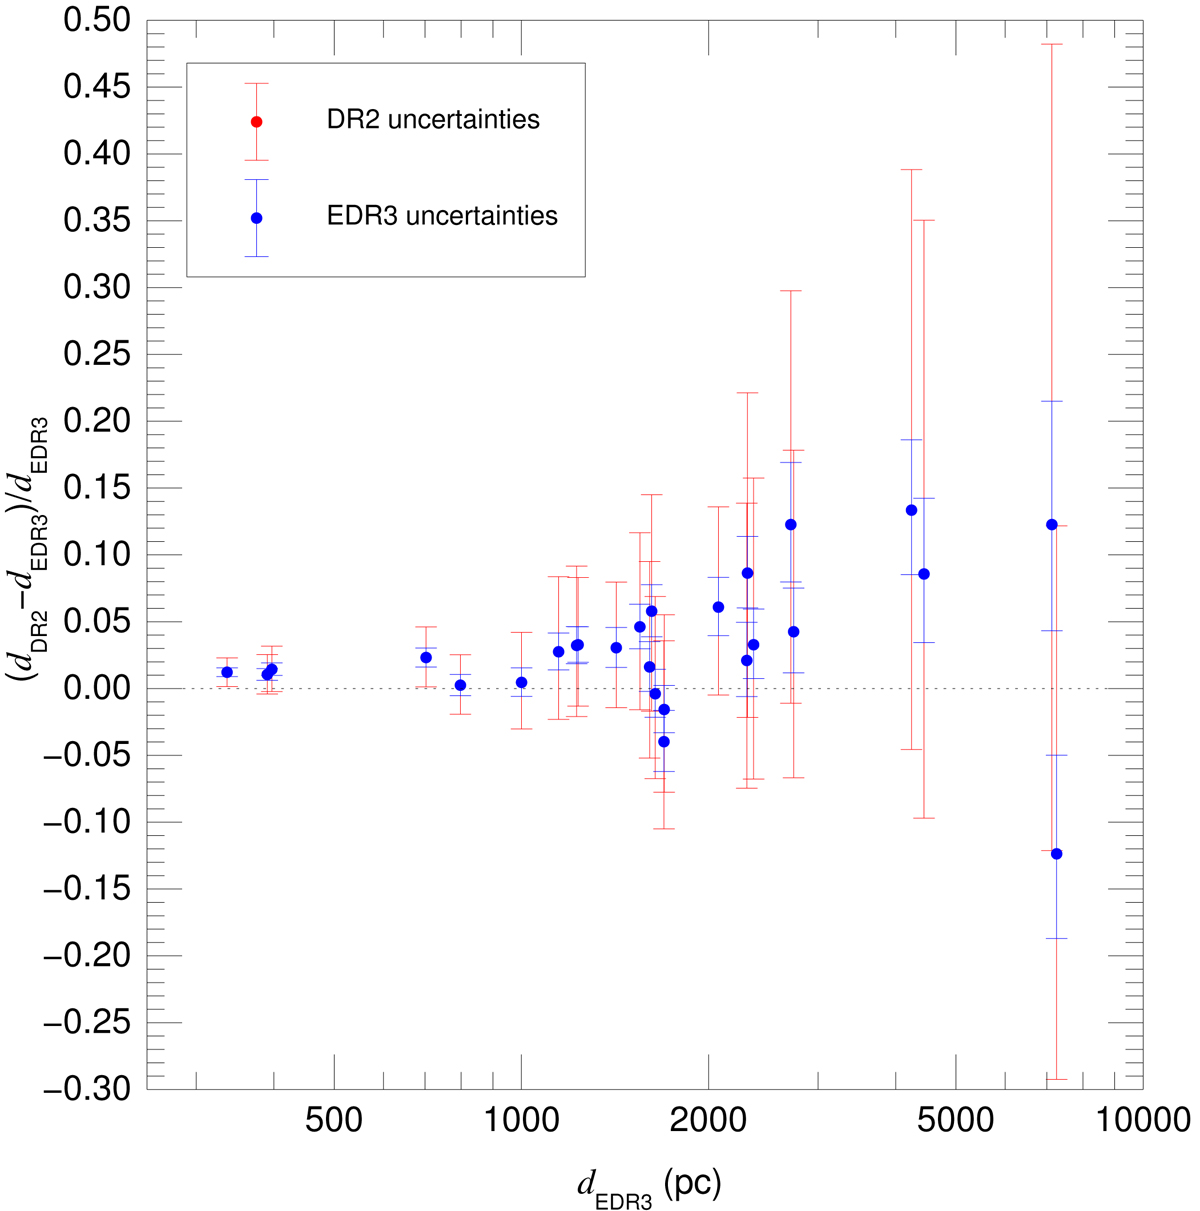
Comparison between distances for the 26 Villafranca groups in this paper using Gaia DR2 and EDR3 data. The Gaia DR2 distances for the 16 groups in Villafranca I were recomputed to use the same selection parameters as in this paper. Red and blue are used to represent the Gaia DR2 and EDR3 uncertainties, respectively.
Current usage metrics show cumulative count of Article Views (full-text article views including HTML views, PDF and ePub downloads, according to the available data) and Abstracts Views on Vision4Press platform.
Data correspond to usage on the plateform after 2015. The current usage metrics is available 48-96 hours after online publication and is updated daily on week days.
Initial download of the metrics may take a while.