Fig. 4.
Download original image
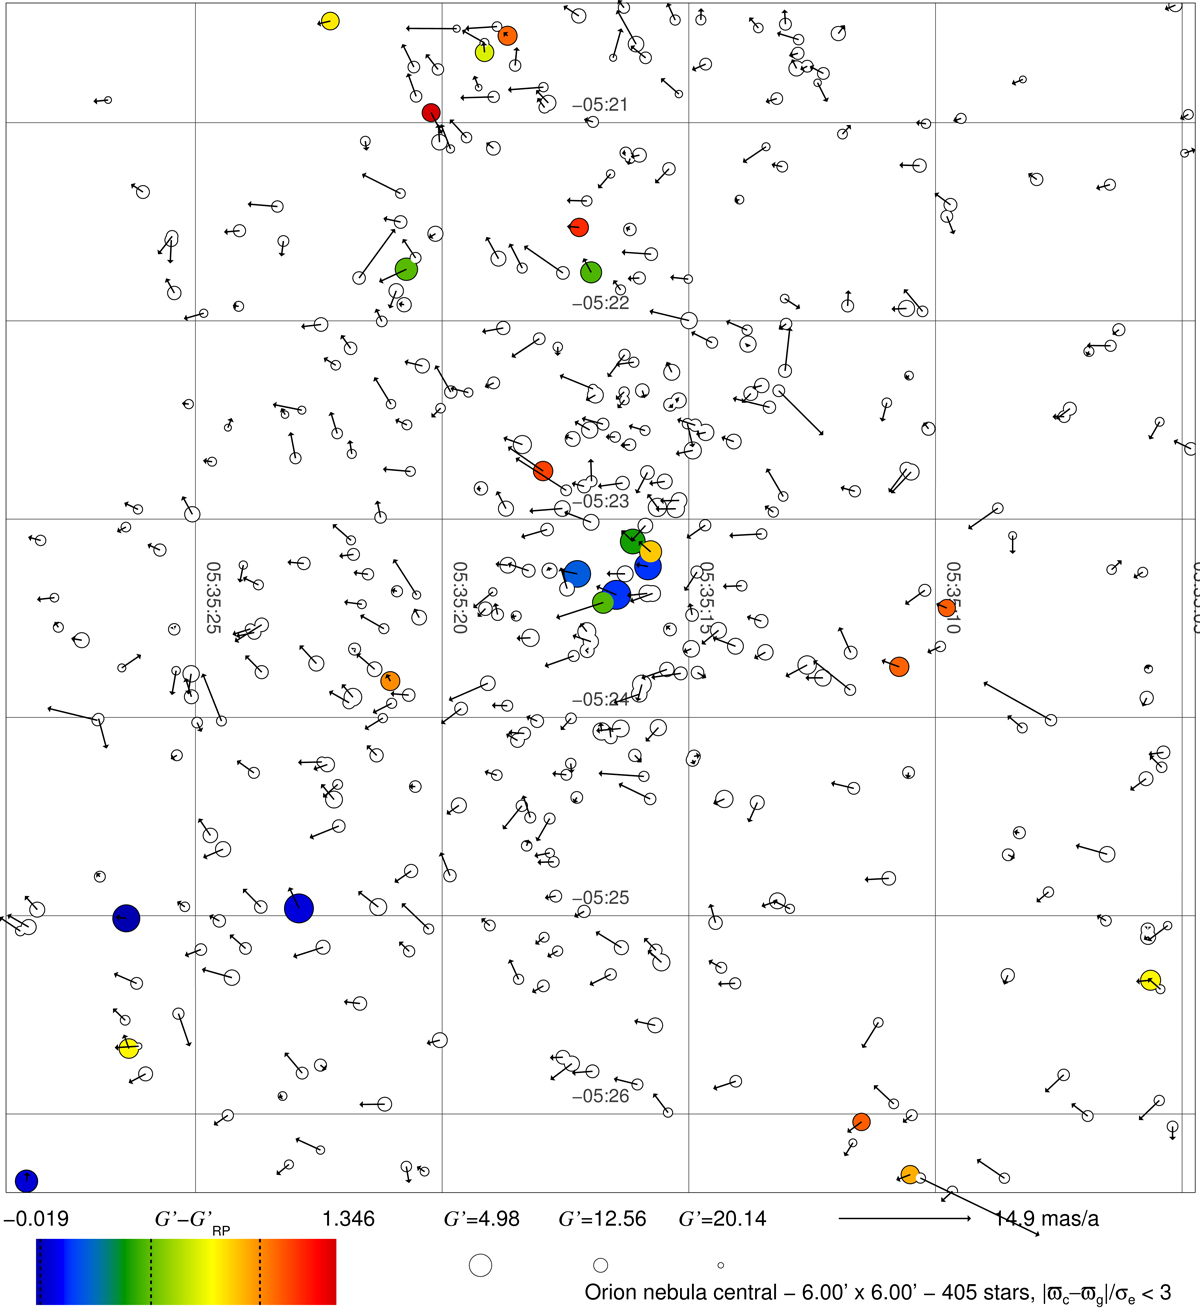
Gaia EDR3 chart of the central 6′×6′ of Villafranca O-023 (Orion nebula cluster). Plotted sources are those with normalized parallaxes within 3 sigmas independently of other filters i.e., a lax selection criterion for cluster membership rather than the strict one used to select the sample in this paper. Symbol color, symbol size, and arrows encode ![]() , G′, and proper motion, respectively, according to the caption. Objects without color either have no
, G′, and proper motion, respectively, according to the caption. Objects without color either have no ![]() or (more commonly) have C* > 0.4 due to nebular contamination. The Trapezium is at the field center.
or (more commonly) have C* > 0.4 due to nebular contamination. The Trapezium is at the field center.
Current usage metrics show cumulative count of Article Views (full-text article views including HTML views, PDF and ePub downloads, according to the available data) and Abstracts Views on Vision4Press platform.
Data correspond to usage on the plateform after 2015. The current usage metrics is available 48-96 hours after online publication and is updated daily on week days.
Initial download of the metrics may take a while.