Fig. 1.

Download original image
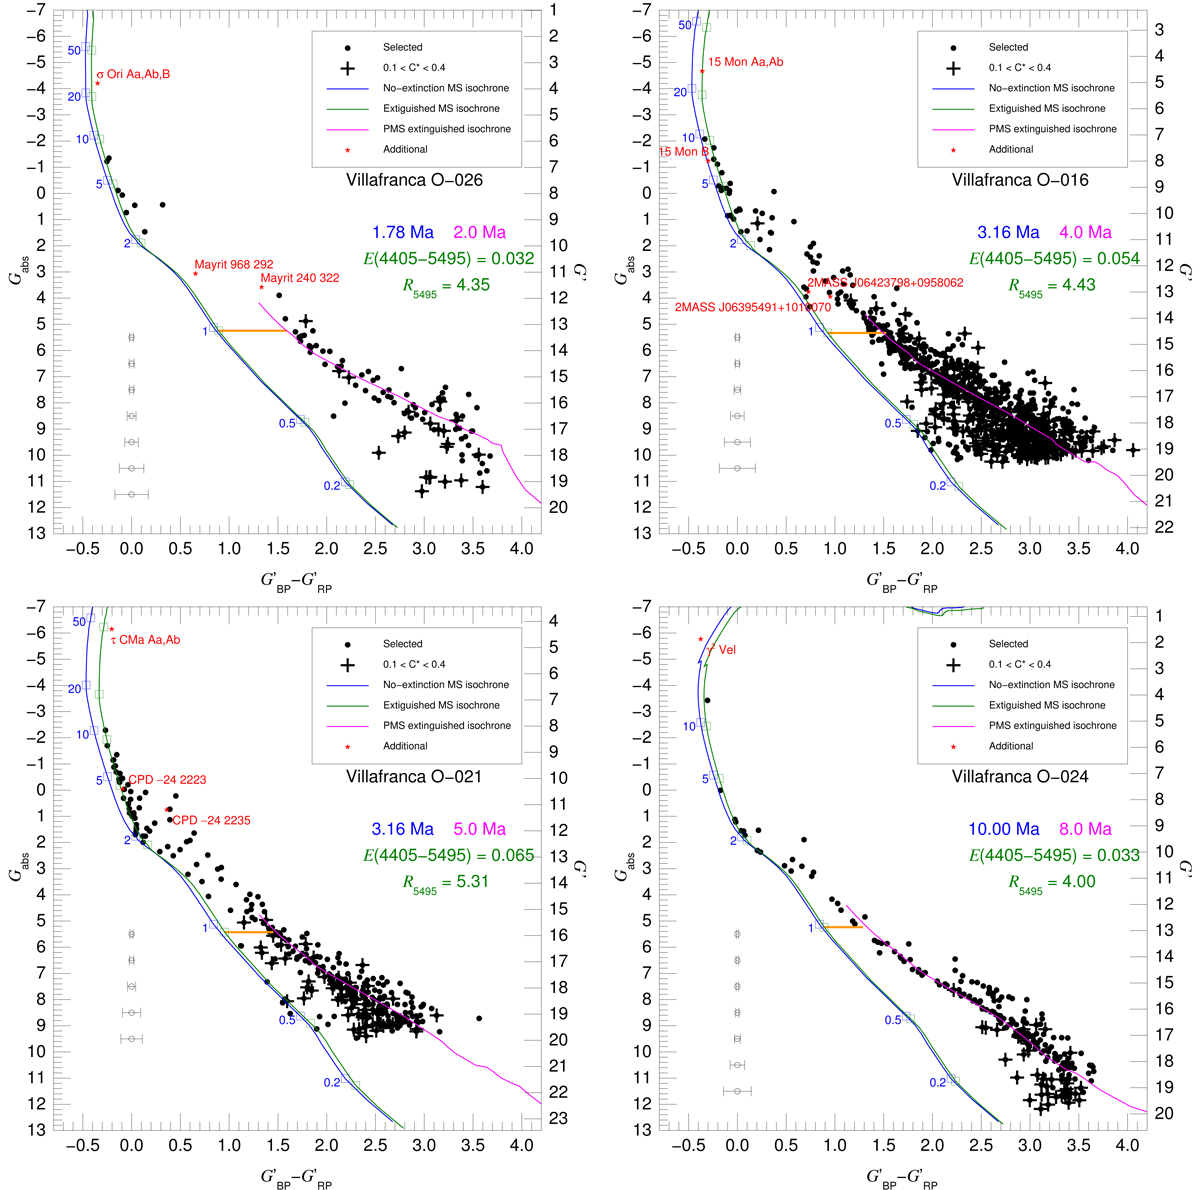
Gaia EDR3 CMDs for four clusters in this paper: Villafranca O-026 (σ Orionis cluster, top left), Villafranca O-016 (NGC 2264, top right), Villafranca O-021 (NGC 2362, bottom left), and Villafranca O-024 (γ Velorum cluster, bottom right). In each case the sample plotted was selected using less restrictive criteria than for the sample used for the distance (the σext restriction was changed to < 0.5 mas and no RUWE filter was applied). Also, likely additional members and possible walkaways/runaways are plotted and labelled in red. Crosses indicate objects in the sample with likely contaminated ![]() . The error bars in the lower left quadrant of each plot give typical color uncertainties for different Gabs bins. The blue and green lines show MS Geneva isochrones (Lejeune & Schaerer 2001) with no extinction and with an average extinction appropriate to the cluster, respectively. Initial masses (in solar units) are labelled along the isochrones and the blue and green text at the right side of each panel gives the age and extinction parameters of the isochrones. The magenta line shows the extinguished PMS isochrone from Baraffe et al. (2015) of the age indicated by the text of the same color at the right side of the panel. The PMS isochrones reach up to 1.4 M⊙. The orange line marks the gap in
. The error bars in the lower left quadrant of each plot give typical color uncertainties for different Gabs bins. The blue and green lines show MS Geneva isochrones (Lejeune & Schaerer 2001) with no extinction and with an average extinction appropriate to the cluster, respectively. Initial masses (in solar units) are labelled along the isochrones and the blue and green text at the right side of each panel gives the age and extinction parameters of the isochrones. The magenta line shows the extinguished PMS isochrone from Baraffe et al. (2015) of the age indicated by the text of the same color at the right side of the panel. The PMS isochrones reach up to 1.4 M⊙. The orange line marks the gap in ![]() between the MS and the PMS at the location of a 1 M⊙ main-sequence star.
between the MS and the PMS at the location of a 1 M⊙ main-sequence star.
Current usage metrics show cumulative count of Article Views (full-text article views including HTML views, PDF and ePub downloads, according to the available data) and Abstracts Views on Vision4Press platform.
Data correspond to usage on the plateform after 2015. The current usage metrics is available 48-96 hours after online publication and is updated daily on week days.
Initial download of the metrics may take a while.


